Pick The ‘Perfect’ Trade Entry Point For Lower Risk & Higher Reward
 The ideal trade entry is one that allows for good stop loss placement and a substantial risk / reward potential. Easier said than done, right?
Well, maybe not. Whilst these “perfect” trade entries may not be frequent, it doesn’t mean they are “hard” to spot. It just takes some training combined with screen time to learn how to find them.
There are essentially three process that I use to find the ideal trade entry. Here, in a nutshell, is what I do every time I am looking for a new trade entry, this is how I think and what I look for:
The 3 keys to finding the “perfect” trade entry:
The easiest way to do this is to first look for any really obvious price action signals on the daily chart time frame. The daily chart time frame, traded in an end of day manner is my favorite way to trade. I am looking for really obvious signals and patterns that “stick out like a sore thumb”, and once you get familiar with the setups I teach, these aren’t hard to spot.
Next, you want to look for confluent factors for the trade that back up the signal. So, you are sort of “reverse engineering” the trade, if you will. You spot the signal, then, you start looking back in time on the chart to see if the signal bar lines up with other key levels or has formed after a pull back within a trend or has some other type of confluence with the chart.
Essentially, you want to line-up as many supporting factors as possible if you want to find the “perfect trade entry point”. The last thing you want to do, if you’ve found a signal that has confluence, is look to see if you can “refine” the entry so that you increase the risk:reward potential of the trade (this is a more advanced concept that whilst isn’t “necessary” can improve risk:reward. I get into this more in-depth in my professional trading course).
Note: Whilst there really isn’t a “perfect” trade entry, we can still try to look for trades that have the most “weight” or confluence behind them.
A brief breakdown of the 3 key pieces of the “perfect” trade entry are:
- Find the signal, pattern, level to trade, this is somewhat obvious, but it’s also a skill that needs to be developed and refined. For this tutorial we will use pin bar entry signals and tailed bar entry signals.
- Look for entry filters and confluent factors; things that back up the trade such as a strong trend, key horizontal support and resistance levels, 50% swing retracement levels other past signals (event areas), moving averages and more.
- Entry tweaks and tricks; such as the 50% tweak retracement entry of the signal bar itself, or simply consider a nearby key level for a more optimum entry point, that allows for better stop placement and larger target.
My typical daily routine to find that “perfect” trade entry:
After I wake up and eat a healthy breakfast (and yes, sometimes I eat Vegemite) and do my morning exercise, I will flip on the charts and see what happened after the U.S. session closed, remember, I am focused on the New York close charts. Since I live in Australia, when I wake up it is in between the U.S. close from the previous day and the European open, so I have a nice time to observe the daily charts in Forex, Stock Indices and major commodities and see what happened before they really get moving again in Europe. Or, if I am looking at my local Aussie markets, since it’s morning it’s the perfect time to enter a trade, IF one is there.
My goal is to scan quickly through my favorite markets to trade and then look for obvious trade signals / patterns that provide me with an edge in the market. If I find one, I will then filter that trade by finding reasons that back up the trade or that make sense with the surrounding market structure. At this point, I am also seeing if the trade maybe doesn’t make sense? Just because I find a potential signal doesn’t mean I always trade it. If a signal has little to no supporting confluence then I will probably not trade it.
Lastly, if I find a signal that meets my criteria and makes sense in the surrounding market structure (confluence), I will then find the best and most logical way to enter it with the goal of best stop loss placement and a high potential risk reward.
Let’s go through some examples:
Example 1:
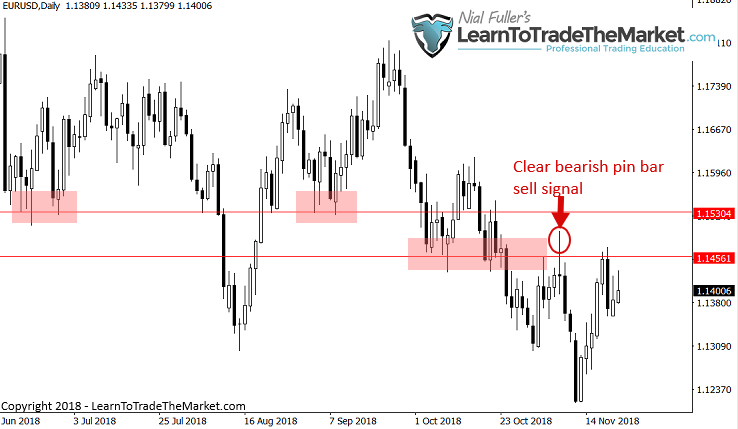
In the chart below, I saw a very obvious daily chart EURUSD pin bar sell signal that looked like it had a lot of confluence behind it, which we will discuss in the next chart. For now, note that the tail of this pin bar was CLEARLY sticking out from the nearby pars, indicating a sharp reversal and rejection of that price area and implying price might move lower in the coming days. I didn’t have to search long or hard for this signal, it literally “jumped” off the chart to me:
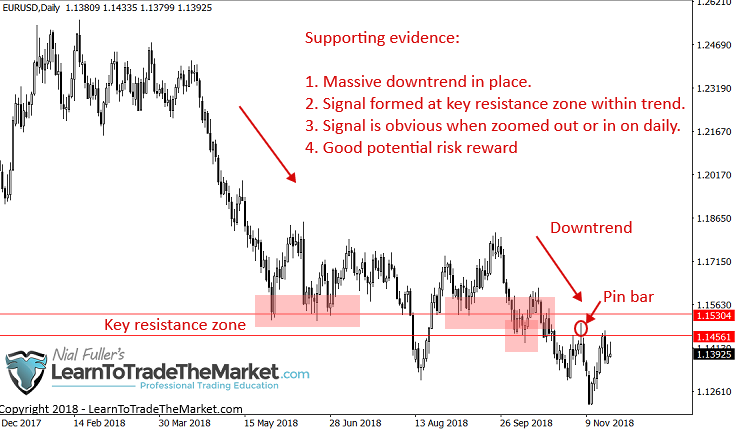
In the next chart, we are checking to see what supporting “evidence” this pin bar signal has. In this case, there is definitely enough evidence to warrant a trade entry. As per the chart below, the market was in a multi-month downtrend and the signal had formed after a pull back to resistance, and a key resistance zone at that. The signal itself was also well-formed and obvious, in my mind this trade was a “go” and all we had to do was set it up, pull the “trigger” and go watch a movie or play some golf or whatever you like to do, just don’t stare at the trade all day after it’s live.
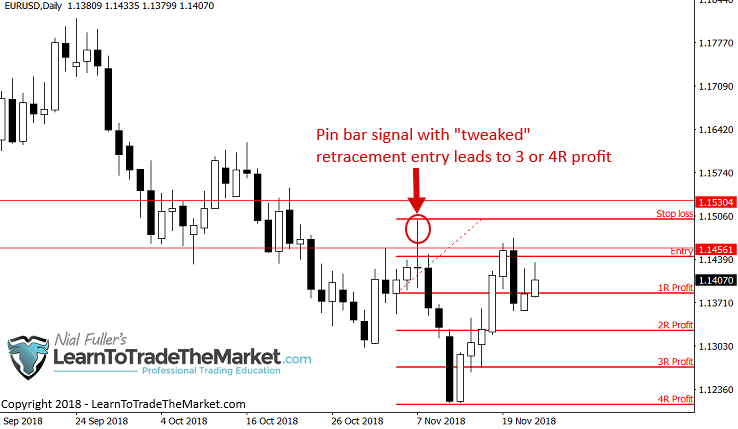
Next, let’s look at the zoomed in view of the above pin bar. We are focusing now on the entry “tweak” as well as seeing if we can improve the risk reward potential on the trade. Notice, in this trade, we could have entered near the 50% point of the pin bar for a much improved risk reward ratio. Realistically, an exact 50% entry on the pin would have been difficult as price just barely touched that level before moving lower again. However, you could still have entered on a retrace of the pin somewhere under that 50% point and with a stop above the pin high. You would have a logical stop placement and a strong 3R to 4R profit potential on the trade.
Example 2:
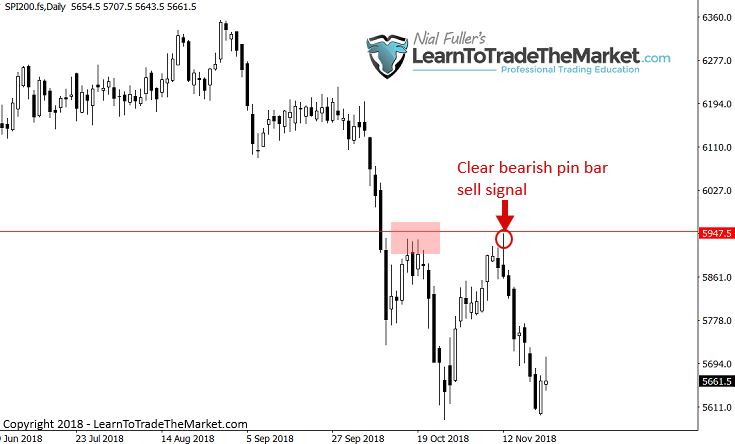
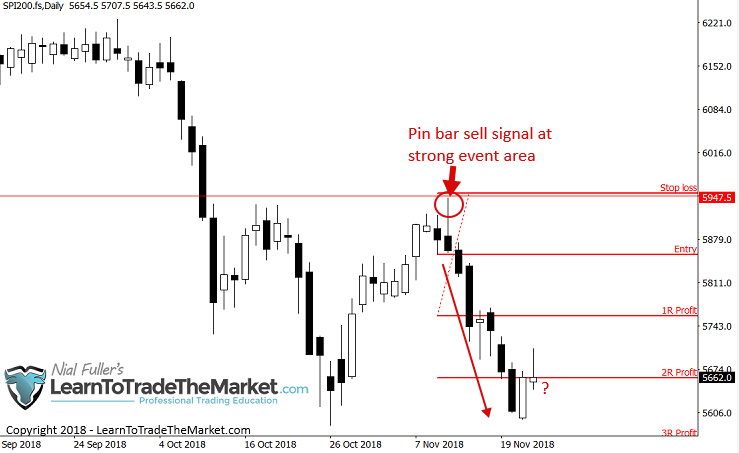
In the example below, we are looking at the daily SPI 200 (Australian Stock Index) chart. Upon glancing at this chart the pin bar circled below quickly caught my eye. It clearly lined up with an overhead level on the daily chart time frame. The tail on this pin bar was clearly sticking out and showed a sharp reversal in price.
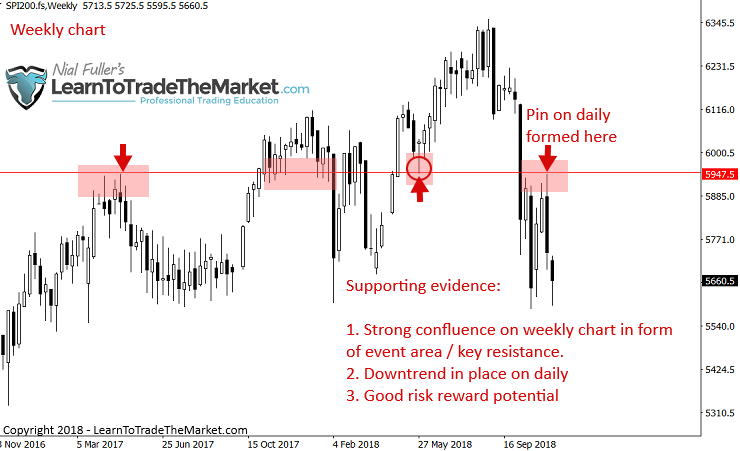
The chart below shows a weekly chart view of the above daily chart. Often, I will check the weekly chart when I find a trade on the daily or 4 hour, to see how that signal makes sense in the context of the longer-term time frame, or if it makes sense at all. In this case, the pin bar on the daily above, formed at a very powerful key resistance level / event area on the weekly chart, as we can see below. It also formed in-line with the downtrend in place on both the daily and weekly charts.
Finally, we see a zoomed daily chart of the pin bar signal we are trading. Note that no retrace / tweak entry was possible here but this trade still had a good 2R Reward potential since the next support was not until quite a ways down as you can see below. Trades like this that form at a key level / event area and have the trend behind them and make sense on the daily and weekly, often lead to fast and big moves…
Example 3:
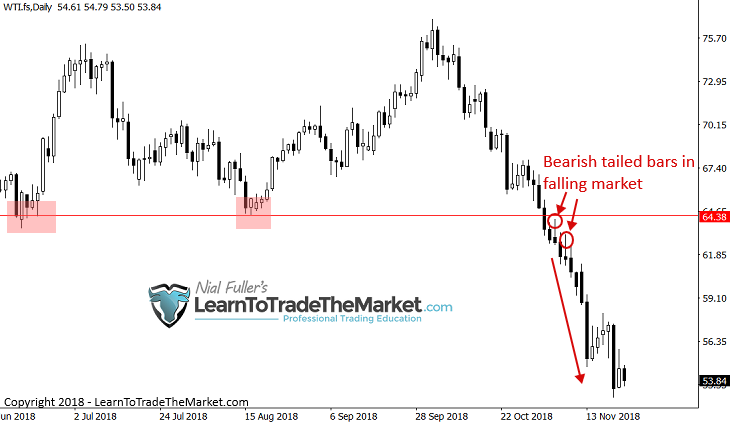
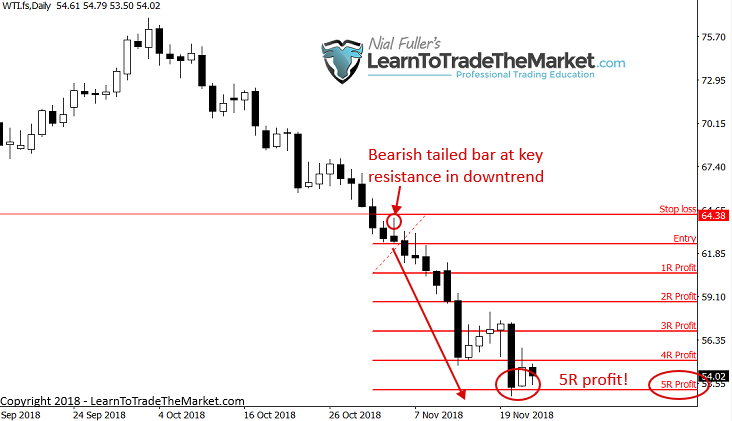
In the next example we are looking at a couple of bearish tailed bar signals that formed on the daily Crude Oil chart. You will quickly notice a very strong downtrend was in place and that these bars formed just under a key resistance level after price broke and closed under that level just prior. Whilst these signals may not “jump” off the chart at you like the first two examples, given the momentum behind the sell-off in this market they would have been obvious setups to the trained price action trader.
Once we zoom out a little more you can clearly see the magnitude of that overhead level as well as the trend that was in place. These strong pieces of supporting confluence made this trade a virtual “no-brainer”.
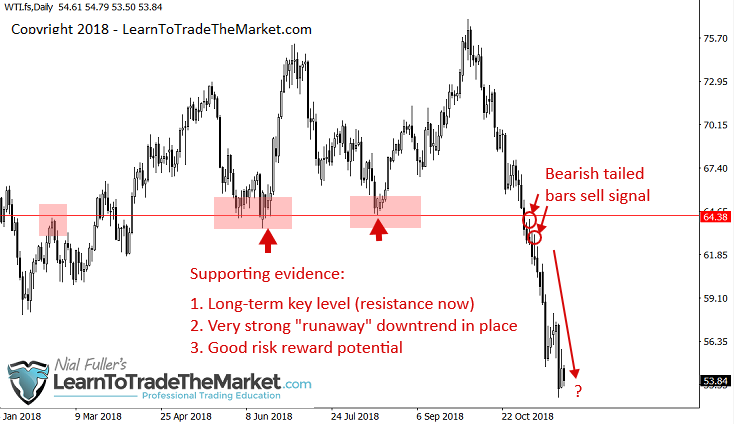
A zoomed in view of the signal on the daily chart shows us that even with a stop loss just above the first tailed bar high (and beyond the level) there was still a huge potential risk reward on this trade because this market was truly in a runaway trend. These types of trends are the best for pyramiding into positions and making a big profit. Notice on just one position here you could have easily grossed a 5R profit. Not a bad payday.
Conclusion
I hope that the main thing you take away from today’s lesson is that the best trades are ones that form with multiple supporting factors. In all of the examples above, the trend was really obvious and the signals formed at a key level in the market. This stuff should not be difficult once you gain the knowledge and understanding of what you’re looking for. However, there is an “art and science” to it that takes some training, time and gut feel to get really good at.
I want you to remember that you’re looking for an “intersection” of a signal and a level or a signal and a trend or even just a level and a trend as in the case of a blind entry. Essentially, what we are doing here is trading like a sniper by waiting for the right pieces of evidence to align and give us the green light to pull the trigger on the trade. All of this becomes easier once you understand how to read the footprint of money on the chart, i.e. the price action. It does take passion and commitment though, I have found as I’ve gotten older that the charts have made more and more sense to me, even the randomness within them.
You have to truly to be in this for the ‘long-haul’ if you want to succeed at it because trading is the ultimate test of the self. The market WILL expose all your human flaws and how long it takes you to truly start making consistent money at trading or if you do it all, depends mostly on how fast or if you can accept these flaws and correct them. Whilst this part of trading is not easy, there are people who can help you; other traders who understand what you’re trying to do and what you’re going through.
Learn To Trade The Market is a collective community of 20,000 + members who are all on the same page and who all have the same end-goal of trading success. My members are following the trading ideologies, processes and concepts discussed in this article and that I expand upon in my advanced course. This is why I created Learn to Trade The Market, because it allows you to “look over my shoulder” via my daily trade setups newsletter where I implement the routine described above and combine that with the core teachings of my course.
Please Leave A Comment Below With Your Thoughts On This Lesson…
If You Have Any Questions, Please Contact Me Here.


question do you take your entry also on the daily time frame or lower time frame
Thanks Mr.Nial for your support but I would like to know about the weekly pinbar is it also important to notice
Hola Niall I really like your articles coz through them we’re able to understand true art and science of trading
the market like a pro,thank you very much
Concerning Example #3, if you had spotted these two tailed bars in the downtrend, how could you enter at the low of the first one after the second one, chronologically, had formed? How could one go back up the chart and enter on a previous bar?
I have seen people claiming to be traders but you, you have practiced and master one kick10000 times. Thanks for transferring displene though ur teaching sir.
El Supremo, you’ve blessed us again with your preaching. We disciples are eternally grateful to you, Lord.
Honestly though Nial this one was good. I just can’t resist imitating some of your other disciples comments!
Cheers Mate take it easy.
Geoff
I like the chart you showing down trend here I like to see down trend stop little more clear.its very interesting. wait for net lesson
harbans
This tutorial is a great one…
Thanks
Awesome, A valuable lesson that reinforces my trading skill and mindset.
Perfectly! Very important lesson! Thanks Mr. Nial!
Thanks, Nial,
Very helpful.
Nial,
I began to use what you have listed in your articles and won 1:1.8. This is the first time I am able to get 85PIPS in my direction. Had I didn’t close out, I would have got 1.2.5. Also thanks for all your replies to all my emails. I will join your course December.
Thanks for all your great articles.
wonderful course.
Thank you Fuller.
I see more and more the power of this science in practical experience. I have an irregular working time and I have seen a snow pin a day or two too late. I write my mistakes and these are strong teachings. Only the truth itself. Thanks :-)
Thank you very educative
Hi Nial! Thanks again for this article.
I have tradet the pin bar on Eurusd 3 day before your pin bar and I was stopped aut. So what to do next time.
Do you maybe looking in this case for small short covering rally and the goo short, or something else.
I don’t have bad feeling about this trade, because I have all 3 Tls, but I was too fast.
Thanks again
Nice points keep on giving me that helpful adsistance
Nice one,this is really helpful thanks.
Very Strong points to wait for these levels and trend,confluences thanks it makes a lot of sense .
Thank you for continuing to reinforce my trade entry foundational knowledge. The fog is slowly lifting!
I am very grateful.
Dear Nail,
Really you are helping to non-membership trader. I will joint with you soon.
Support. resistance, trend, never change, this is simple and workedd 100 years ago and will work mext 100 years, Good onya, Nial
Excelent, Nial. Another good article where you explain showing with examples.
I have been using the trend, level and signal part in all my trades, and im getting good at it. I end up taking a few stops, but okay, im getting used to it. God bless you, Nial.
Eneias Nascimento.
Great input Nail. God bless you
Thanks Nial very insightful loved the article mind opening for me thanks a lot
Thank you Nial forconstractive article.
Examples are the perfect way to learn and improve our trading skills. A great article. Thank you Nial, you are the Best
Great and empowering teachings from the Maestro. Thank you sir.
HI,
VERY GOOD ARTICLE…AND VERY HELP FULL..
THANK YOU VERY MUCH MR NIAL…GOD BLESS YOU!
MANOHAR NADKAR
Nice lesson sir stay blessed
Are these trades pointed out to members when the trigger candle appears?. Thanks
this is very informative,thanks Nial for sharing.
Your interpretation of the market is so clear and obvious for us to understand i can really see the effort and hard work you put in to help us advance in our trading career. I think for us to pay you back is by showing the same commitment and hard work so that we can become better traders. We love and appreciate you for this brilliant article and please keep them coming coz I’m eating every word. ????????
Thanks Nial you make this look easy hey. Do you also consider fundamentals in your analysis, if so how do you incorporate it.
Lesiba
South Africa
Very insightful, thanks Fuller.
Great examples. Some of them were actually MY trades. I also use 8 and 21 EMA’s as dynamic S/R, specially when trading on a trend.
Good afternoon Nial,
Thanks for the article it is easy and straight to the point. What I want to find out is that how do you factor in fundamentals in this type of analysis as an additional point of confluence.
Regards,
Lesiba
Good afternoon
I am completly new to trading
Looking at all this chart I dont understand what you are talking
Please is there any place where I can start from scrach and practice before I start live trading
Thanks
Very good , thanks.
Support and resistance is definitely the way to go , which you have proved over and again, makes absolute sense.
Very good reminder Nial thanks
Peter