How To Set Up MetaTrader Forex Charting Platform
MetaTrader Forex Trading Tutorial: Setting up MetaTrader 4 for price action trading charts.
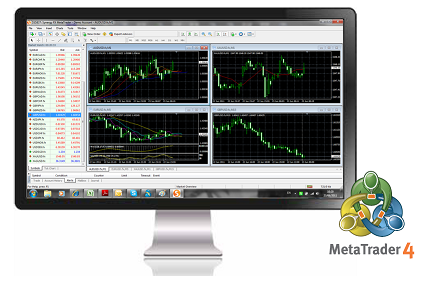 This lesson is going to provide you with a tutorial of the basics of using the MetaTrader trading platform. MetaTrader 4 (MT4) is the most popular Forex trading platform and forex charting software in the world. I personally trade on this platform and I recommend my readers & members use it too.
As anyone who has followed me for a while knows, I trade and recommend New York close 5-day per week charts. The reason is that closing prices are the most important in the markets, and the New York close marks the end of the current Forex trading day and then the new day starts in Asia. As the New York session is the most traded session behind London, it’s important to see who won the battle between the bulls and bears at the New York close and as the current Forex trading day ends. You can download the correct 5-day New York close charts for free via this link: New York Close Forex Charts Download.
This tutorial is going to show you how to setup the MT4 platform for optimal price action trading, thus we won’t be discussing any of the automated “robot trading” / expert advisor functions of the platform as they are not a part of the price action trading strategies that I trade and teach.
After you read today’s lesson let me know if it helped you, if you learned anything new about the MetaTrader platfom, or if you would like me to add any explanations to this tutorial next week… you can contact me here.
Navigating the MetaTrader platform: The main windows
Below is a screen shot of approximately what your MetaTrader platform will look like when you first open it up. Your charts will probably be black and green however, with a bunch of indicators all over them. We will discuss how to get your charts setup with a white background for clean price action forex trading in the next section.
For now, let’s cover the main functions of each window you see in the image below:
1) The first window at the very top is the “Toolbars” window, here you’ll find many different icons that allow you to do many different things, we will cover most of these icons later on, for now just be aware of the toolbar window and that it is full of different tools and shortcuts for you to use.
2) The next window is the “Chart” window, this is obviously where you will see the current chart(s) you have open.
3) Next, see the “Market Watch” window on the upper left hand side of the screen. The market watch window lists all the markets available from your broker and gives you their real-time bid and ask prices. Note: to unlock all markets offered by your broker, simply right click within the market watch window and then select the “show all” option.
There’s a “tick chart” tab at the bottom of the market watch window, click on it and you’ll see the current price activity of the pair you have selected in the market watch window, tick by tick,…I don’t really use this but thought I’d just tell you what it’s for real quick.
To see which currency pairs I prefer to trade as well as an example of how you might want to populate your market watch window, check out my article on the best forex pairs to trade.
– Below we can see the main windows of the MetaTrader platform:
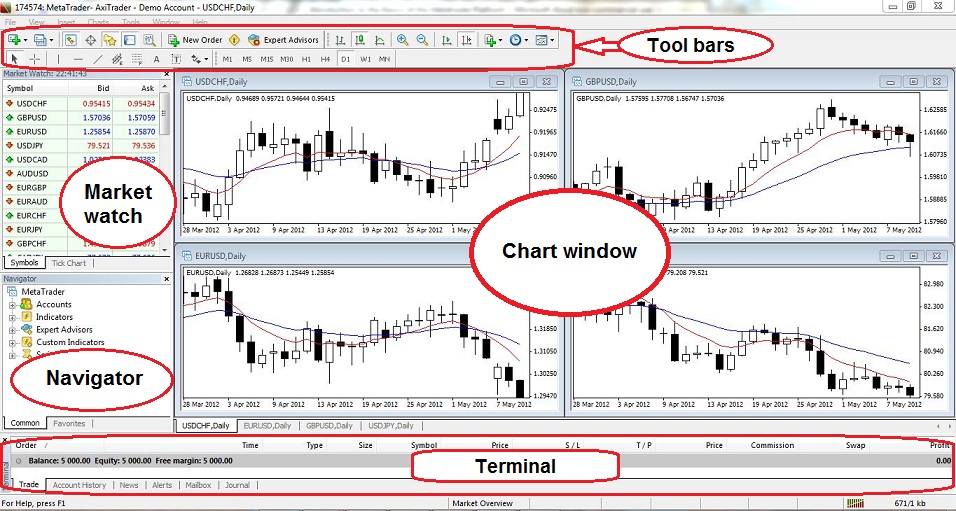
4) Below the market watch window is the “Navigator” window. In this window you can see your account(s), as well as a variety of indicators, expert advisors and scripts…both of which you can and should ignore. To learn why I don’t use many indicators or trade with expert advisors, check out this article on forex indicators, and this one on forex robots.
5) Finally, the terminal window appears at the bottom of the screen and within it you’ll find these six tabs: Trade, Account History, News, Alerts, Mailbox, and Journal. You can go through each tab to get familiar with what it does. The “trade” tab is the most important as this is where your pending and open trades can be viewed. The “account history” tab contains all your account activity since you opened it, primarily deposits, withdrawals, and closed trades. You can also generate detailed reports of your trading history here.
Setting up your charts for clean price action trading:
Next, we need to get our charts setup for optimal price action trading. You can customize your price charts in MetaTrader to reflect your own personal style and color preferences. I personally prefer a white background and black foreground for the cleanest and simplest approach. Here’s how to setup a clean white chart for optimal price action trading:
1) How to open a chart
There are three main ways to open a chart window on the platform. You can click on the “file” menu at the very top left of your screen and then click “new chart”, or you can right click in the market watch window on the specific currency pair you want the chart for and then select “chart window”. There’s also a “new chart” icon in the toolbar, see the image below:

2) How to set chart properties
Once you’ve got your desired chart open, you want to get it setup for clean price action trading. To do that, you just need to right click on the chart, and then select “properties” which is located at the bottom of the menu that appears, you’ll then see this box appear:
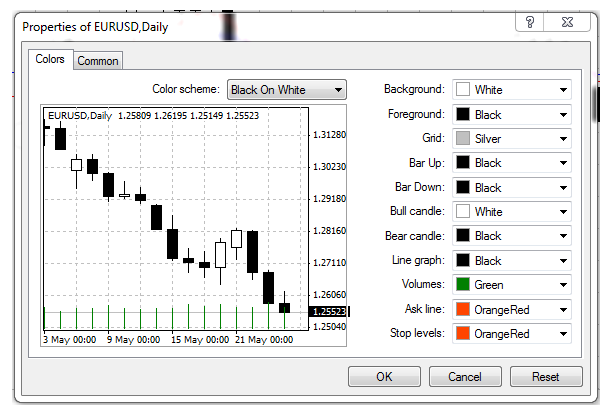
Now, as you can see in the “color scheme” window there is actually already a “black on white” theme that you can use. My personal settings look a little different though, you can see them here:
Note I have taken off the “grid” and “volume” functions.
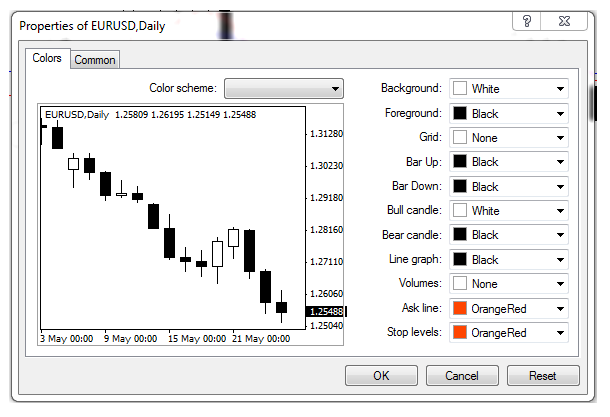
The “common” tab located to the right of the “colors” tab in the window above, allows you to select or deselect certain features, such as volume, grid, period separators, and others. You can also change the chart to bar, candlestick or line chart in the common tab. It’s pretty self explanatory so play around with it a bit to get more familiar with the options.
3) How to save your chart setup as a template
Once you’ve adjusted your color scheme and other chart properties to how you want them, you have the option of saving your chart setup as a template, then you can easily apply the same properties to other charts. To save a template you can click on the “Template” icon in the toolbar and then select “save template”, or you can right click on the chart itself and then select “Template” and then “save template”. You can also click on the “Charts” menu at the very top of your platform and then select “Template”. See here:

I’ve also labeled a few other functions on the toolbar in the image above. We can see in the “chart type” box you can select bar, candlestick or line chart; we use forex candlestick charts in the members’ area. You can also see the function to zoom in and out of the current chart selected, as well as the time frame icon which goes from 1 minute chart up to monthly chart. I personally never look at a time frame under the 1 hour, and my trading course and community is focused on teaching time frames from the 1 hour and above, with the primary focus being on the daily chart time frame.
A cool tip about templates:
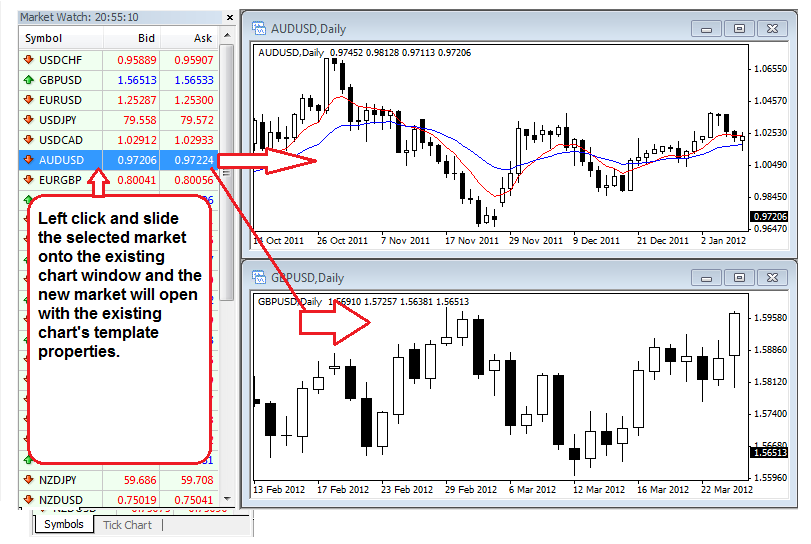
To quickly open a new chart with the current open chart’s template properties, simply select the market you want to see in the market watch window and then left click and slide it (drag it) over to the chart window containing the desired template. That new market will automatically open in the existing chart window with same template properties:
How to add moving averages and other analysis tools to you charts
I do implement the 8 and 21 daily chart exponential moving averages for trend analysis and to see dynamic support and resistance levels, note that I don’t use them in the traditional “indicator cross-over” sense. So let’s discuss how to put these EMAs on your charts.
The easiest way to do it is just to click the “Indicators” icon in the toolbar, then select “trend” then “moving average”:

You’ll then see this box appear:
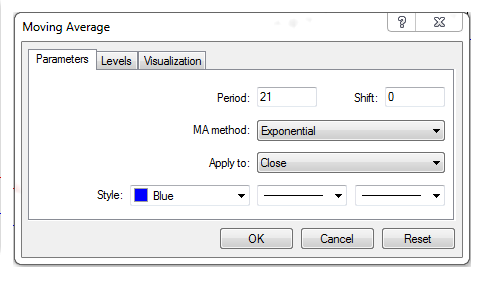
You can also add indicators by going to “Insert” at the very top of the platform and then clicking on “indicators” then “trend” then “moving averages”, then the box above will appear.
You want the period set to either 8 or 21, depending on which EMA you are putting in at the time, then the “MA method” should be Exponential and “Apply to” close. You can pick whatever colors make you feel happy, just make sure the colors of the 8 and 21 contrast nicely so you can easily tell them apart, I use red for the 8 day EMA and blue for the 21 day EMA.
You can then save that particular chart setup with the EMAs as template. You can have a number of templates saved as you can see, then you can quickly go from one template to the next. I have one clean template setup (see above) with no EMAs and then one with the 8 and 21 day EMA. You can learn more about how I use the EMAs in my forex trading course. I do not use any moving averages on the 4 hour chart.
The other main analysis tools that I use are the horizontal line tool and the Fibonacci tool. They are pretty self explanatory, but with the Fibonacci tool I usually only have the 50% and 61.8% level as those are the only ones I look at. Simple right click on the Fibonacci tool after applying it to your charts and then you can change its properties.

How to setup my 4 primary time frames in one market profile
To quickly see the 1 hour, 4 hour, daily, and weekly time frame in one window, you can do this:
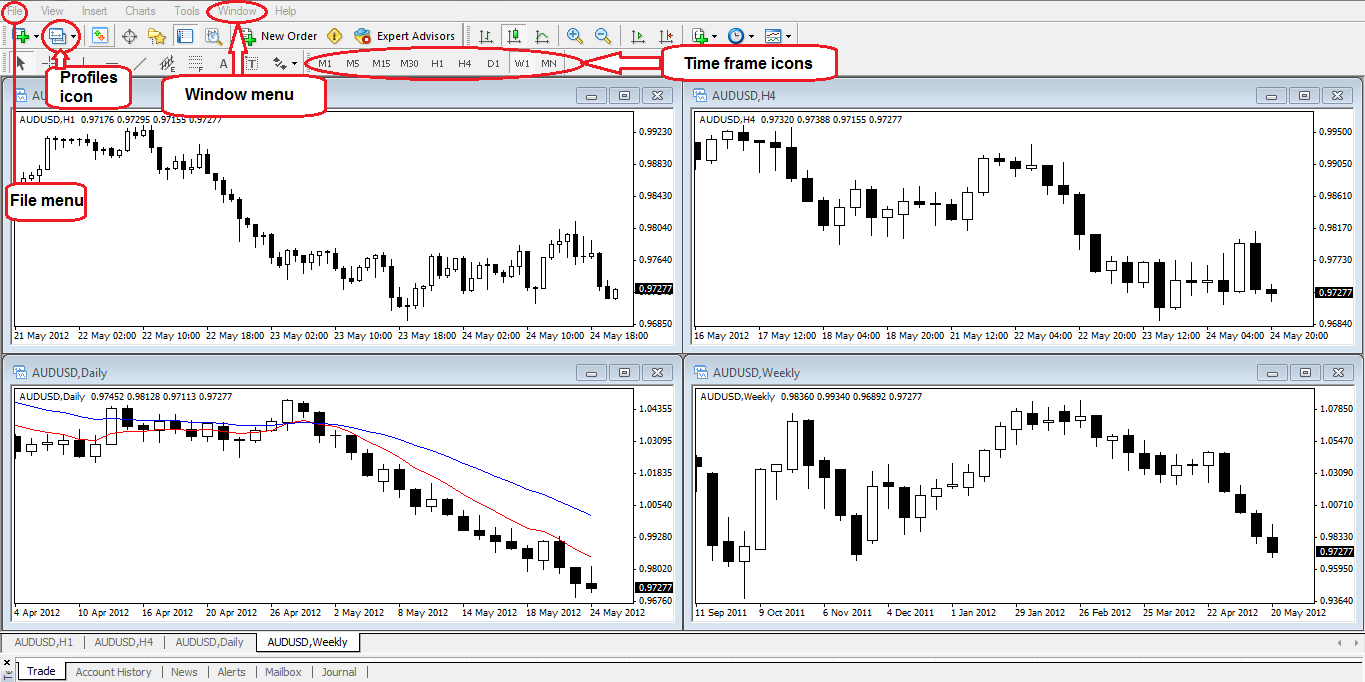
Open 4 new charts of the same currency pair and then use the time frame icon to set them to 1 hour, 4 hour, daily, and weekly. Now, go to the “Windows” menu at the top of the toolbar and select either “Tile horizontally” or “Tile Vertically”, they are both going to make your chart windows the same when you have 4 charts.
Now, once you get the 4 time frames setup, you can go to the “File” menu or click on the “Profiles” icon and save your current window arrangement as a profile.
Cool tip: If you want to you can save each market as its own profile and then quickly scroll from one profile to the next by clicking “ctrl + F5” at the same time, to see the previous profile press “ctrl + F6”. See here:
Quickly analyze multiple markets
You can have as many different chart windows open as you want in MetaTrader, and you’ll see at the bottom of the platform are tabs that allow you to quickly open a chart to analyze or edit it. You can open up a chart from the tabs at the bottom and then quickly change its time frame or template via the time frame and template icons in the toolbar that we’ve already discussed above. These tabs make it easy to get a quick view of many different markets and this is the primary method I use to scroll between markets on MT4.

In closing
Now you know the basics of the MetaTrader 4 trading platform and how to get it setup for clean price action trading. If you want more instruction on how I trade with price action on the MetaTrader platform, check out my price action trading course and members’ community.
You can get the trading platform shown above that we use by clicking this link for the correct New York Close Charts + MetaTrader Forex Platform.
Related Trading Tutorials:
How To Correctly Set Up MetaTrader Forex Charts
How To Place Different Trade Entry Types Using MetaTrader Platform
How To Set Up Price Alerts In MetaTrader 4 & 5
Beginners Introduction To Japanese Candlestick Charts
Why Serious Traders Need ‘New York Close’ Forex Charts
Please Share This With Other Traders, Click The Like & Share Buttons Below.
Please Leave A Comment Below With Your Thoughts On This Lesson…
If You Have Any Questions, Please Contact Me Here.



Thanks boss
Your blog is very helpful to know about MetaTrader Forex Charting Platform. Thanks for sharing
Greetings Dear Nial
Thank you for sharing your information with us . Im new at forex trading and need all the help i can get . Thank you and stay blessed.
Thanks Sir for teaching me
Your materials are very good for beginners like my myself. In fact I love them, I wish you are my mentor .
I have 9 quotes on my meta screen but I would like the complete list how do I get this.
Right click and select ‘ show all ‘ on the flashing price quote board.
You can then drag and re order them by clicking and moving market up or down in the list.
How do I customize meta trader4 on my tablet without coming to reset every time I log in?
Very helpful. Thank you.
Thank you and God bless you.
Thank you so much for the information
Thank .you for this training. It is great for beginners
Good stuff I will bereading all i can and hope to be joining you soon Greeny
this is very helpful and i want to say thank you for helping us.
Hi Nial, I realy appreciate you sending me the links for MT4, thank you very much. Best regards
Thanks for the MT4 set up guidelines and tips one thing that is frustrating me is how to keep the tool bars as standard each time I open up MT4 when I set up my profiles or templates it does not seem to keep the toolbars and each time I open it up I have to click on view and then select the various toolbars I want – there must be a simple thing I am missing, thanks
Dear Nial,
Is there any chance you can add the template file you use save us setting up each individual component.
Thanks
warren
Hi Nial
This was really helpful.
But I know nothing about the indicators.
I’m a newbie here.
So I don’t understand what the Fibonacci, horizontal line, and moving average are meant to do.