Japanese Candlestick Patterns In Forex Trading
Japanese Candlestick Patterns
• A Brief History of Japanese Candlestick Charting Patterns.
Candlestick charts originated in Japan during the 18th century. Since no defined currency standard existed in Japan during this time rice represented a medium of exchange. Various feudal lords deposited rice in warehouses in Osaka and would then sell or trade the coupon receipts, thus rice become the first futures market. In the 1700s legendary Japanese rice trader Homma Munehisa studied all aspects of rice trading from the fundamentals to market psychology.
Homma subsequently dominated the Japanese rice markets and built a huge fortune. His trading techniques and principles eventually evolved into the candlestick methodology which was then used by Japanese technical analysts when the Japanese stock market began in the 1870s. The method was picked up by famed market technician Charles Dow around 1900 and remains arguably the most popular form of technical analysis chart in use by today’s traders of financial instruments.
• Why use Candlestick Charts?
Candlestick charts show the same information as bar charts but in a graphical format that provides a more detailed and accurate representation of price action.
Candlestick charts visually display the supply and demand situation by showing who is winning the battle between the bulls and the bears.
Candlestick charts reveal another dimension of the given period’s price action by pictorially displaying the force (or lack of force) behind each price bar’s movement.
Candlestick formations make all single bar and multi-bar patterns significantly easier to spot in real time, thus increasing your chances of catching high probability trade setups. In addition, because candlestick charts use the same data as bar charts (open, high, low, and close), all Western technical signals used on a bar chart can easily be applied to a candlestick chart.
Candlestick charts offer everything bar charts do and more, using them is a win-win situation because you can use all the trading signals normally used on bar charts with the added clarity and additional signals generated by candlesticks.
Candlesticks charts are more fun to look at.
• The Anatomy of a Candle
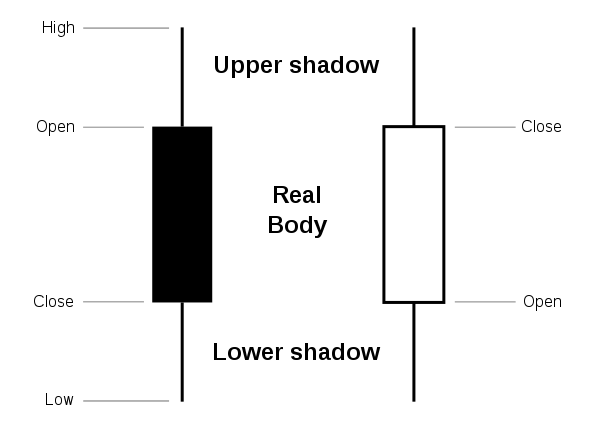
Candlesticks have a central portion that displays the price distance between the open and the close. This area is known as the real body or simply the body.
The price distance between the open and the high for the period being analyzed is called the upper shadow, sometimes referred to as an “upper wick” as well. The highest price paid for a particular period is the marked by the high of the upper shadow.
The price distance between the close and the low for the period being analyzed is called the lower shadow, sometimes referred to as a “lower wick”.
The real body displays the opening and closing price of the security being traded. Closing prices have added significance because they determine the conviction of the bulls or bears. If the security closed higher than it opened, the real body is white or unfilled, with the opening price at the bottom of the real body and the closing price at the top. If the security closed lower than it opened, the real body is black, with the opening price at the top and the closing price at the bottom. Depending on the price action for the period being analyzed a candlestick might not have a body or a wick.
To better highlight or visualize price movements, modern candlestick charts (especially those displayed digitally) often replace the black or white of the candlestick real body with colors such as red (for a lower closing) and blue or green (for a higher closing).
• Core Candlestick Patterns
There are multiple forms of candlestick patterns; here is a brief overview of the most popular and widely used single and multi-bar patterns commonly used today.
Bullish Candle
Signals uptrend movement, they occur in different lengths; the longer the body, the more significant the price increase
![]()
Bearish Candle
Signals downtrend movement, they occur in different lengths; the longer the body, the more significant the price decrease.
![]()
Long Lower Shadow
These candles provide a bullish signal, the lower shadow must be at least the size of the real body; the longer the lower shadow the more reliable the signal.
![]()
Long upper shadow
These candles provide a bearish signal, the upper shadow must be at least the size of the real body; the longer the upper shadow the more reliable the signal.
![]()
Hammer
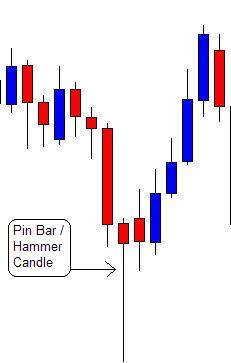
The hammer is a bullish signal that occurs during a downtrend. The lower shadow should be at least twice the length of the real-body. Hammers have little or no upper shadow. When a hammer occurs during an uptrend it is known as a “hanging man” and is a bearish signal. Because of the bullish long lower shadow however, this pattern needs bearish confirmation by a close under the hanging man’s real body.

Shooting Star
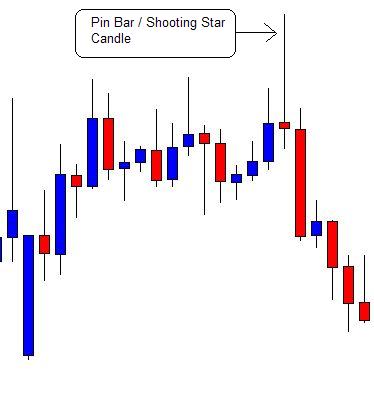
This candle has a long upper shadow with little, or no lower shadow, and a small real body near the lows of the session that develops during or after and uptrend.
![]()
Harami
The Harami is a two-candlestick pattern in which a small real body forms within the prior session’s larger real body.

Doji
The Doji is a candlestick in which the session’s open and close are the same, or almost the same. There are a few different varieties of Dojis, depending on where the opening and closing are in relation to the bar’s range.
![]()
Dragonfly doji
The Dragonfly Doji has a long lower shadow, the open, high, and close are at or very near the session’s high. This pattern often signals reversal of downtrend.
![]()
Gravestone doji
The Gravestone Doji has a long upper shadow, the open, low, and close are at or very near the session’s low. This pattern often signals reversal of an uptrend.
![]()
High wave candle / long-legged doji
This candle has a very long upper or lower shadow and a small real body. If the opening and closing price are the same the candle has no real body and is then called a Long-Legged Doji. The first picture is a high wave candle the second is a Long-Legged Doji.

Engulfing candles
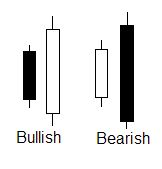
The bullish engulfing pattern consists of large white real body that engulfs a small black real body in a downtrend. The bearish engulfing pattern occurs when the bears overwhelm the bulls and is reflected by a long black real body engulfing a small white real body in an uptrend.
Spinning tops
Spinning tops are simply candles with small real bodies.

How Candlestick patterns translate into Nial Fuller’s Price Action Setups
My favorite price action setups consist of the pin bar, the inside bar, and my proprietary fakey setup. The above candlestick patterns can easily be condensed down to one of my three price action setups or may be applicable to more than one of my price action setups. It can be difficult to keep track of the various forms of candlestick patterns. This is why I feel like my three main price action setups do a great comprehensive job of including all the relative candlestick patterns and make them easier to understand in the context of daily price action. Let’s take a look at some charts with examples of some of the various candlestick patterns converted into my price action setups.
Pin Bars
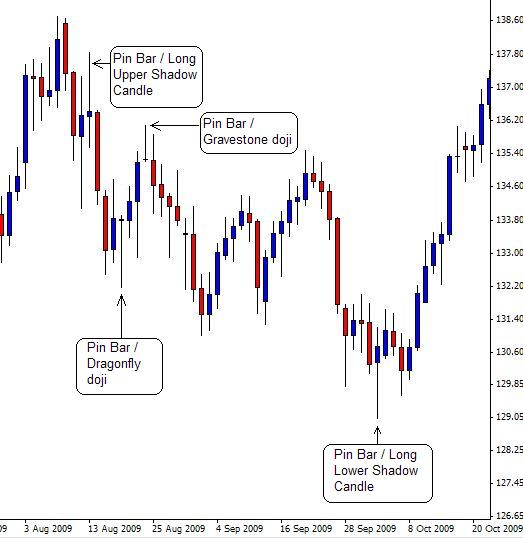
The pin bar can include the following previously described candlestick patterns; long lower shadow candles and long upper shadow candles, hammers and shooting stars, dragonfly and gravestone dojis.
Inside Bars
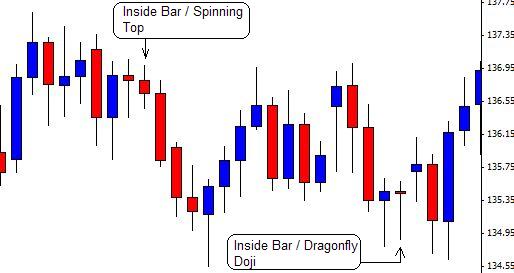
Inside bars can technically encompass any candlestick pattern because they are simply a series of at least two candlesticks where the first candlestick completely engulfs the entire range of the subsequent candlestick, however, more often than not inside bars end up being spinning tops or dojis. Note, the inside bar is different from the “engulfing pattern” because it includes the entire range of the bar, from high to low, where as the engulfing pattern only includes engulfment of the real body of the candle. I generally trade inside bars in the context of a strongly trending market as they are often great entry points into trends. However, often times inside bars will occur at major market turning points as well as the previous trend loses momentum, pauses and forms an inside bar, and then changes direction.
The Fakey Setup
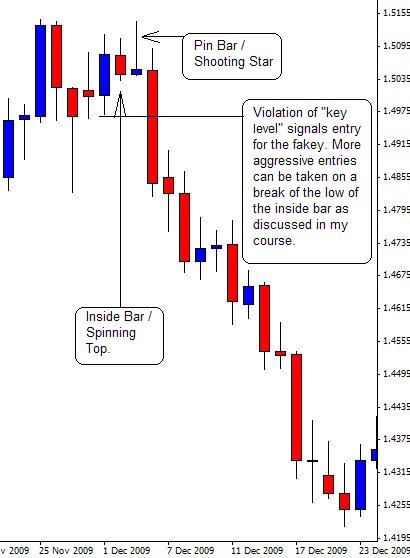
My fakey setup is essentially a multi-bar pattern that consists of a false break from an inside bar pattern or a key level. The fakey can consist of a number of different candlestick patterns. Often times the fakey setup will consist of a bullish or bearish engulfing pattern which is completely engulfing the range of a spinning top or doji candle which gives rise to a false break bar that can take the form of any of the candlesticks above that qualify as pin bars.
In Conclusion
Candlestick charts offer a more vivid depiction of price action than what a standard bar chart can provide. Candlestick patterns in and of themselves are useful, however there are many different names and interpretations of candlestick patterns which often can induce confusion and can be hard to keep track of. You will find that my price action educational material condenses all of the important candlestick patterns into 3 simple yet highly effective price action setups. I feel that my take on candlestick patterns expressed via my proprietary ideas on price action trading is a much more efficient, simple, and profitable way to trade candlesticks and I think after studying my forex trading course you will feel the same way.
Related Trading Tutorials:
How To Correctly Set Up MetaTrader Forex Charts
How To Place Different Trade Entry Types Using MetaTrader Platform
How To Set Up Price Alerts In MetaTrader 4 & 5
Beginners Introduction To Japanese Candlestick Charts
Why Serious Traders Need ‘New York Close’ Forex Charts
Please Share This With Other Traders, Click The Like & Share Buttons Below.
Please Leave A Comment Below With Your Thoughts On This Lesson…
If You Have Any Questions, Please Contact Me Here.


Thank you sir ,very informative.
wonderful article
Awesome intepretation of the candlesticks Nial. This helps a lot to demystify understading reading the market
Clarity is most important when trading
The candle patterns, to me is easier to comprehend than other indicators. very concise.
Thanks once again, #NIAL
Very nice.
I really need to learn how to do this trading
Pls help me, I don’t know anything about it, I’m just a beginner
This is the BEST explanation of candlesticks I’ve ever read!
Really helpful and easy to understand.
Thank you, Nial!
Hello sir, I am beginning to hate all those technical indicators because price action strategy makes trading easiest (not “easier” this time around). I love it; my trading skill has now increased, and am more confident.
It’s indisputably clear that to be successful in trading, price action must be thoroughly mastered.
Thanks my mentor, professor Nial, for this great articles. You are blessed.
Hi Nial
I want you to teach me the candlestick chart for me to understand it well.
I am beginner and never trade before.
Thank you
Stephen
That is the best explanation I’ve ever read.Be blessed for impacting us with knowledge.long live
I am learning this one at a time as a newbie.
Nial is the type of teacher I fell in love with during my secondary school years.
If all teachers are like you, and if all authors write educational texts the way you write your posts, simple, consise and interesting, then the world of education will be so much easy…
I love you Nial
Loaded article this.Clarifying all the candlestick patterns..thanks mentor.
Thanks Nial, is quite a great education on candlestick pattern
Am glad reading this information on candlesticks, thanks very much
Thanks for your education of candlestick pattern.
Thank you very much
Great thanks
Thanks for your explanation Nial, although I still have to go back to these explanation repeatedly so as to master them.
Powerful
Thank you Nail
i LIKE IT
Its an amazing summary of trading, which I have ever come across thanks to the femous trader
Thumbs up Nial for an educative article. i will try to master the patterns for my trading strategies
loved this…
In fact, words clogged up my throat to spill—-you lay narrow streams of light on my tunnel-vision , dredged my shallow coast of knowledge. Very tailored, attuned, enlightened. I’m now confident enough to trade like a snipper. Lolz. Thank you, Mr Nail.
nice article it enlarge my knowledge of trading
good but havent understand better
dear fuller thanks for you mr fuller for educat forex they are very good exuss me iam dont know english you are very good i am iranian and love you good by shahnaz iran
This looks good !
Is this good enough to detect patterns in real time trading ?
fantastic for newbees
Very useful, thanks as I will try my luck using your techniques
thanks. real help to my building blocks of knowledge toward competency when trading.
Great explanation with graphics! Others often just explain candles by descriptions, but having it in graphics makes it more easier to understand.
BASIC, BETTER AND THE BEST TO MOST I HAVE TRIED TO READ
Explaination is excellent. Thanks Nial.
Perfect
GOOD WORK
EXPLANATION IS GREAT
Loved this so much. Awesome teaching.
Thanks Nial for your help and lucid explanation about every aspect of trading.
I really appreciate your concerns.
Additionally, for a newbie in Forex , what do you recommend in the first place?
Is studying books a good start in trading career?
Thanks
good explanation candlestick