Why Trading With Indicators Destroys Forex Trading Success
 Anyone who has followed my forex trading educational material for any length of time knows that I do not promote the use of indicators as one’s primary market analysis or entry tool. Instead, I teach my students to trade off of a plain vanilla price chart by learning to read the pure price action that occurs each day in the Forex market. This article is going to explain exactly why trading with indicators is detrimental to your success as a trader, and why you should learn to trade with simple price action setups instead. So, forget about the confusing haphazard mess that indicators leave all over your charts and let this article open your eyes to the power and simplicity of trading with pure price action.
1. First hand vs. second hand data…
The root of the problem with using indicators to analyze the forex market lies in the fact that all indicators are second-hand; this means that instead of looking at the actual price data itself, you are instead trying to analyze and interpret some variation of price data. Essentially, when traders use indicators to make their trading decisions, they are getting a distorted view of what a market is doing. All you have to do is remove this distortion (the indicators) and you will obtain an unobstructed view of what price is doing in any given market. It seems easy enough, yet many beginning traders get suckered into clever marketing schemes of websites selling indicator based trading systems, or they otherwise erroneously believe that if they learn to master a complicated and “fancy” looking indicator they will for some reason begin to make money consistently in the market. Unfortunately this could not be further from the truth, let’s begin by looking at the two main classes of indicators and discuss why they are flawed:
• Leading and Lagging indicators…
Technical chart indicators come in two different forms; they are either “lagging” indicators or “leading” indicators. Lagging indicators are also known as “momentum” indicators, the most popular lagging indicators are MACD and moving averages. Lagging indicators claim to help traders make money by spotting trending markets, however, the problem is that they are “late” to the ball, meaning they fire off a buy or sell signal into a trending market after the market has already started to trend, and just as it is probably about ready for a counter-trend retracement.
The other problem with lagging indicators like MACD and moving averages is that they will chop you to pieces in consolidating markets; firing off buy and sell signals just as the market is about ready to reverse and re-test the other side of the trading range or consolidation area. So, essentially, the only real use that lagging indicators have is in helping to identify a trending market, and I do actually use certain moving averages to aid in trend identification. Check out my price action trading course to find out exactly how I implement moving averages with my price action setups, they are the only indicator that I use and I do not use them for anything other than identifying dynamic support and resistance areas.
Leading indicators include such popular ones as the stochastic, Parabolic SAR, and Relative Strength Index (RSI), these are also known as “oscillators”, because they oscillate, or move, between a buy signal and a sell signal. The problem with these leading indicators is that they work horrible in trending markets because they show “over-bought” and “over-sold” conditions nearly the entire time the market is trending. So, if a market is in a strong uptrend, an oscillator will show the market as being over-bought for the majority of the uptrend, even if it continues rising for a great deal of time. The opposite is true in a downtrend; oscillators will show over-sold conditions almost continually in a downtrend.
This means that these “leading” indicators try to get traders to pick tops and bottoms; an over-bought or over-sold condition implies that the market is due for a correction, when in fact this may not be the case. The problem is that no one ever knows how long a market will trend for, so you are going to have a ton of false signals before the actual top or bottom of the market occurs. And guess what? It is often the exact top or bottom that is showed in examples of these oscillating indicators by people who are trying to sell indicator-based trading systems. They don’t show you the numerous losing signals that were fired off leading up to the actual top or bottom however.
So, because we have lagging indicators that work ok in trending markets but terrible in consolidating markets, and leading indicators which work ok in consolidating markets but terrible in trending markets, many traders try to combine them on their charts in order to use them to “filter” each other. You can probably guess what results from the combining of numerous opposing indicators all over your charts; a heap of confusion and mess that causes second-guessing, doubt, over-trading, over-leveraging, and every other emotional trading mistake you can imagine.
2. Clean charts vs. messy charts…
Let’s take a look at the way many traders try to trade with lagging and leading indicators all over their charts, and then let’s compare this to trading with nothing but a plain vanilla price chart and price action.
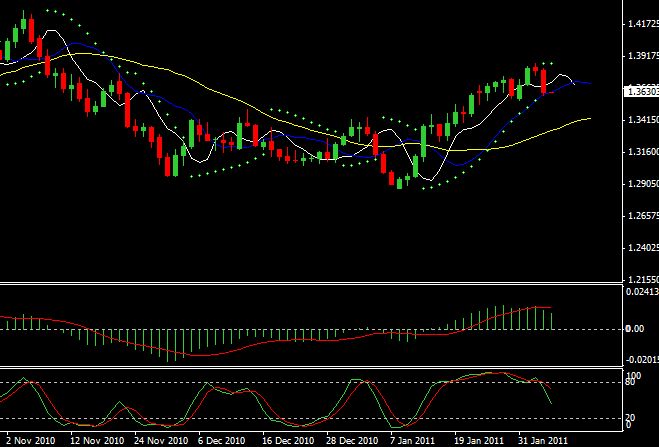
Below is the EURUSD daily chart with some of the more popular indicators; stochastic, MACD, Parabolic SAR, and a few moving averages. You can quickly see just by looking at this chart how confusing it is, and you can also see that there are a lot of unnecessary variables on this chart. There is simply no reason to make trading more difficult than it is, but having all these indicators on your charts does exactly that:
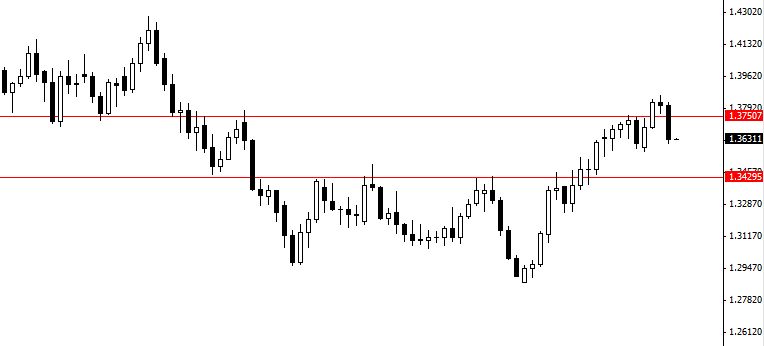
Now let’s look at the same chart with no indicators at all, there is nothing but pure price action and a couple of horizontal lines drawn in to show significant support and resistance levels. It’s obvious this chart has less clutter and less confusion, all it shows is the natural price movement in the EURUSD. By learning to read this natural price movement and the conditions it occurs in, we can trade in a very simple yet effective manner.
It is also worth noting that due to the fact that there are no indicators underneath the price, like the MACD and Stochastic in the above chart, you have a completely uninhibited view of price which allows for a less distorted and larger view of the price action than if you had multiple indicators taking up the bottom portion of your screen as can be seen in the chart above.
3. Clarity…
As we can see in the above two images, the clarity that you get when trading off indicator-free, pure price action charts, is very obvious and significant. Being focused is very important as a trader, when you have 5 different indicators on your charts all telling you conflicting messages, this simply does not contribute to a focused and clear mindset, but rather it induces confusion and indecision.
Having less parameters to analyze causes your brain to work more efficiently and allows you to rely more on your own natural trading instincts. These trading instincts become fine-tuned and fully developed when you learn to read price action on a “naked” price chart, and as you become a more proficient price action trader eventually you will develop the ability to make trading decisions with increasing degrees of accuracy and less effort.
4. Taking a closer look at two popular indicators…
Let’s actually dissect two of the more popular indicators out there; Stochastic and MACD, and then compare them to trading with pure price action.
The Stochastic indicator:
“There are two components to the stochastic oscillator: the %K and the %D. The %K is the main line indicating the number of time periods, and the %D is the moving average of the %K.
Understanding how the stochastic is formed is one thing, but knowing how it will react in different situations is more important. For instance:
• Common triggers occur when the %K line drops below 20 – the stock is considered oversold, and it is a buying signal.
• If the %K peaks just below 100, then heads downward, the stock should be sold before that value drops below 80.
• Generally, if the %K value rises above the %D, then a buy signal is indicated by this crossover, provided the values are under 80. If they are above this value, the security is considered overbought.” (The above information about the stochastic oscillator is quoted from investopedia.com)
The MACD indicator:
“To bring in this oscillating indicator that fluctuates above and below zero, a simple MACD calculation is required. By subtracting the 26-day exponential moving average (EMA) of a security’s price from a 12-day moving average of its price, an oscillating indicator value comes into play. Once a trigger line (the nine-day EMA) is added, the comparison of the two creates a trading picture. If the MACD value is higher than the nine-day EMA, then it is considered a bullish moving average crossover.
It’s helpful to note that there are a few well-known ways to use the MACD:
• Foremost is the watching for divergences or a crossover of the center line of the histogram; the MACD illustrates buy opportunities above zero and sell opportunities below.
• Another is noting the moving average line crossovers and their relationship to the center line.” (The above information about the MACD is quoted from investopedia.com.)
From the above two descriptions of the Stochastic and the MACD indicator, we can see it almost hurts your brain physically to read all the parameters involved in calculating them and how exactly they are to be used. The over-arching theme of such indicators is that you have to follow specific rules to use them. This means you have to be sitting in front of your computer waiting for the indicators line up exactly right before entering a trade. Many traders combine 2 or more indicators and require multiple signals to “line-up” on each indicator before taking a trade. You can see how quickly this jumble of messy and overly-complicated lines, colors, and signals all over you charts can confuse you and even cause you to panic in frustration. I actually got a headache just doing the research for this article because I know that indicators like these are so pointless and unnecessary that it hurts my brain to think about it.
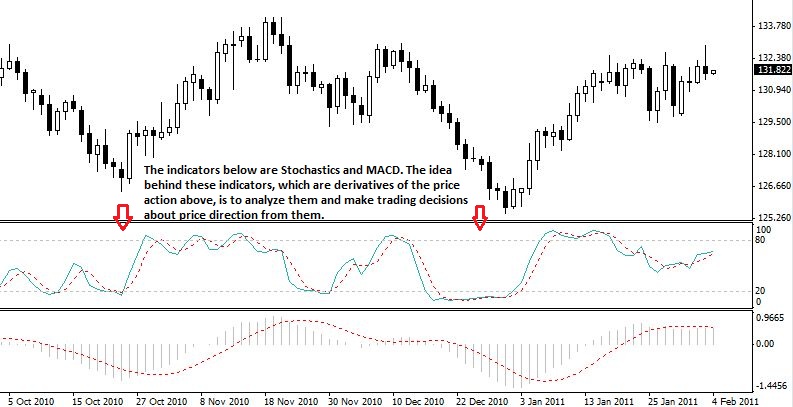
Let’s now look at a couple examples of charts with the Stochastic and MACD indicators on them compared to the same chart with no indicators but only price action setups marking the important trading signals.
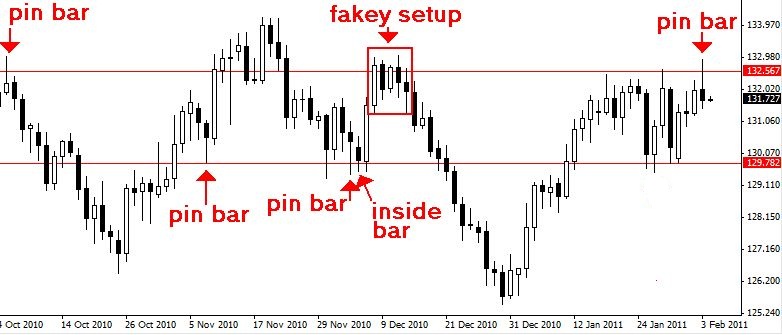
Now compare the above chart to the exact same chart below with nothing but pure price action setups and support and resistance levels marked. It becomes clear when you do an exercise like this that trading off pure price action is much more logical and advantageous than trying to draw the same ultimate analysis from something OTHER THAN price. Why would you try to analyze squiggly lines that are derived from the “core” price data when you can learn to analyze and trade successfully off simple price action setups which actually ARE the “core” data? Too put trading with price action in the context of a sales metaphor; you are cutting out the middle-man and buying directly from the producer.
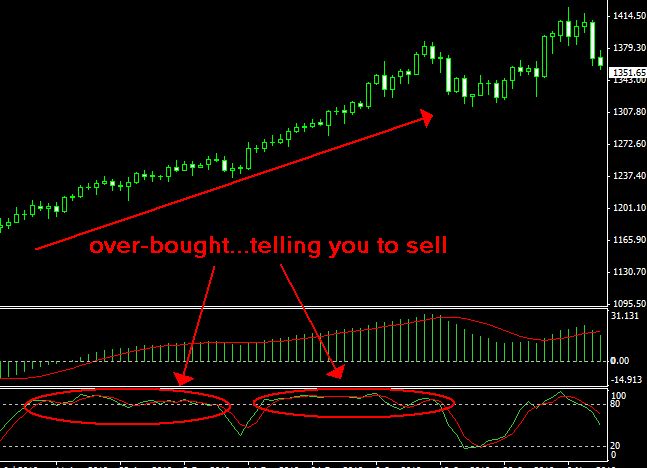
The chart below is a daily chart of gold. Notice how the Stochastic indicator was showing an over-bought condition for multiple months in 2010 during what was a very strong and vigorous uptrend full of many profitable price action entries. If you were a follower of the Stochastic indicator you would have constantly been thinking the top was in because you would be looking everyday at your indicator that was telling you the market was “over-bought”. This is proof that the only thing that matters in any financial market is what the price action is telling you, not what some mathematic equation is predicting “should” happen. It is common knowledge after all; that what “should” happen in a market is not often what “does” happen, unless it is tipped off by price action.
Now we see the same chart above with only price action:
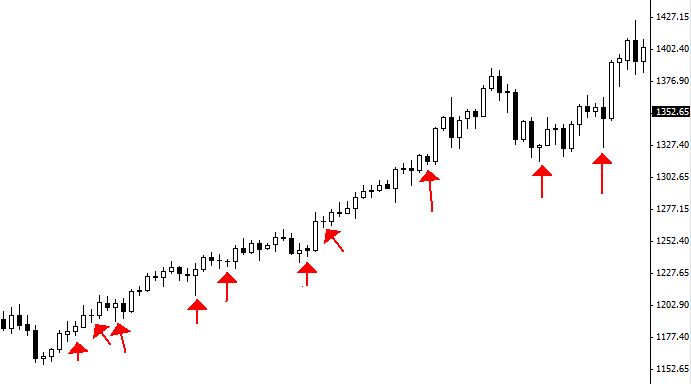
The arrows in the chart above each mark a price action setup that I teach, if you had been trading this uptrend in gold last year you would have obviously been much better off just trading the price action rather than trying to over-analyze and over-complicate everything with a bunch of messy indicators all over your charts.
5. Conclusion…
If it is not extremely obvious by now why price action trading is a far superior forex strategy than any indicator-based strategy, it should be. If you want to truly understand price dynamics and the mechanics of financial markets, you need to learn to analyze price action on an indicator-free price chart. Even if you don’t go on to become an expert price action trader, you still need to have a solid understanding of how to analyze a “naked” price chart and how to trade with nothing but price action and important levels in the market. If you end up using some other trading strategy or system, your knowledge of price action and how to trade it will only make that strategy or system more effective.
The bottom line is that indicators make you lazy because they lull you to sleep in believing you don’t really need to do any work or learn anything besides how to read your “mechanical” indicators that will tell you what to do and when to do it. Price action is great because you can form decisions about future outcomes and direction with greater accuracy and speed than any other trading method because price action is the most current market analysis tool there is. Eventually your brain and subconscious will sync up together and trading off pure price action setups will be like riding a bike; once you adapt to it you will be able to ride it very well and it will become like second nature. Price action is the most clean and logical way to analyze and trade the forex market, learn to trade off price action sooner rather than later if you want to get your trading on the right track.


The problem I get with articles such as this is that I can see dozens of “pin bars” in the charts displayed but the text only concentrates on those that fit the strategy … what about those that don’t fit the strategy? How do you know to ignore them? Of course it may be that I am too hamfisted in my identification of pin bars and need to have more finess but if I do where do I learn that finess?
We just focus on the pin bar at KEY LEVEL, INFLUENCE AREA where the reversal can be occur.
Excellent articles, for as long as i live i’ll never have another indicator on my chart!
Thanks man God bless you?
thank you so much Niel about price action,i was very confused and didnt understand those messy indicators,as a beginner i almost gave up.
Hi Nail
Cry of joy have over-taking ME seen i started reading your article my trading have seriously changed. ( in fact am crying…………………………………………………………………why haven’t i seen this website for-long) but no problem GOD HAVE ALREADY WIPE AWAY MY TEARS.
I noticed this problem in 2011 and since then I only use indicators as a visual aid. I think indicators are a distraction. If you must use them use more stable ones.
I just had to let you know that i am an AVID reader of all your newsletters. I find them not only inspirational but it gives me a wow factor cause your advise is simple and realistic.
I was about to give up forex trading until i came across all your archived newsletter covering various topics…i am now glued as i am thoroughly enjoying your simplistic approach to trading which now sounds far more appealing…
thank you thank you thank you….God Bless You for sharing all your insights in such a thorough but efficient manner.
95% of traders are using indicators; so 95% of traders loose money…
nail this article is great man i like the moral u are implementing to our by the grace of god we will all be successfulland buy eaily next i will take your course
great Nial, as usual.
wow super nial, such a acceptable truth and clear support to price action strategy
Oh men, I have to learn how to read forex price, thank you
After bumbling around indicators for years the light is coming over the horizon. I have really taken up your training and after a frenetic year with .. I have now stopped trading save for a carefully planned Tuesday or Wednesday poke into the market with a pin bar or fakey if one is there. Great work.
Really great .Firm again!!Really benefit!I nobody guidance,Here is my best teacher!Support!
thank you so much for your, just want to learn more about price action strategy…what is your chart template do you use?
This is very good stuff for free!! It is easy to follow and appreciate.You deserve your success, and it is apparent you are a good teacher.Take care!
Wow, it have removed lots of dust in my brain. Thanks for your clear and easy teaching!
Actually camarilla indicator draws support and ressistance lines on my chart based on yesterdays high , low and close values.There are only two lines one support((red line) and one resistance line(green line)
But I think your price action is more reliable.
what a postive article for the support of price action! I have eliminated all indicators and enjoy sucess of trading!
I’m a newbie (4 months), after reading as much as possible from other sites I couldn’t understand the use of lagging indicators?? But stuck them on anyway!(MACD)and a leading one (RSI). I found them so confusing my brain started to melt! Even today I went short on EUR/USD as RSI was showing over bought and the price continued to go up by 50pips?? I’m now taking them off!! You make trading sound so simple keep up the good work. Many thanks.
Excellent article, detail explanation – I didnt know how contrary signals can indicators send in one moment. Your style of trading is clear, your articles are very valuable. Thanks a lot from Slovakia
A Great reminder of how misled I was in my early trading days. Thanks Nial.
Hi Nial,
You are a GREAT MENTOR)))) I’ve learnt from several mentors, but your technique has convinced me to stay with you finally…THANKS a lot!!! Rgds from Germany
hi Nial,
This technique is superb, i have been developing something similar to your concept and now i just saw the masterpiece completed in your website, thanks alot and keep up the good work…
cheers..
chris
Hi Nial,
Thanks for the article. It’s refreshing to see that these indicators are overcomplicating matters, as I thought it was just me thinking this!
Great stuff, I will be signing up to your course next week for sure!
Cheers
Jim
Great advice, Nial. Thanks. Trade the candle light, not the shawdows it makes.
thanks for the lessons to give. your lessons to me are very valuable
Hi Nail you are a genuiue fx price action teacher who want to help upcoming fx traders like me . The free acticle you sent to me was a great partfinder in the fx world , I will join your paid course soon
Great article. I have never liked using indicators but at first I got caught up in them after watching many other traders. Due to my ignorance as a newbie trader I thought all these ‘experts’ knew what they were doing. Actually now I can understand the real price action within the chart I know that these traders didnt have that much expertise at all. Whenever I see a chart plastered with indicators it makes my stomach flip and I loose all interest is the person, piece of writing that accompanies it. I laughed when you said in the above article – ‘I actually got a headache just doing the research for this article because I know that indicators like these are so pointless and unnecessary that it hurts my brain to think about it’. I know exactly how you feel!
How important do candlestick formations and patterns become with the lack of indicators? I was always fascinated by the names and shapes and thought it’d be cool to be a candlestick pro. This strategy seems to mesh well with recognizing contained candlesticks and certain types of tails. The focus on simplicity and discipline is great.
Great article. It has taken me awhile to clear off my
indicators, but am feeling whole now with a clean screen.
Thanks again.
Join LTTTM and learn with like minded traders. Indicators are for people with too much time on their hands who are more interested in the look of their chart than making money. Also, by not having all the indicators you won’t have to squint looking for the candles!!
Very good. Thanks a lot for showing us a good way in the forex world
We are forever indebted for your unyielding efforts to help us with our trading careers.thanks a lot.
..as far as I have shifted myself from “indi” to PA few times already, I can honestly say that just myself I have developed one indi strategy which work well. Anyway, just bought the course and ready to learn the way I wish to trade, clear PA. Many thanks for this web.
Ant.
Hello Nial,
I have read and re-read your forex articles and my trading have improved a lot. Thanks a lot Nial.
Dear Nial,
With out a doubt, this has to be the best and most educationally honest forex trading website out there!
Guys, I have no affilliation with Nial- apart from getting his emails as you all do – I seriously suggest that anybody who wants to learn how to be a successful forex trader to read and re-read this website and get on to Nial’s Price Action course.
I have spent time with some industry hedge fund managers and they teach exactly what Nial is teaching you here; the only Nial has made it affordable comapared to paying thousands to attend mentorships with ex-wall st traders.
Now with that said, my very own friend has lost trades based on the trading decisions of very prominent traders who are ex-wall street traders. And I can definately confirm that Nial is the most generous when it comes to responding to emails and being dead honest! I have personal experience with exchangin emails with him in which he has saved me alot of money.
Seriously guys, READ and RE-READ and get his PRICE ACTION COURSE!
Regards,
Adam
Hi, Just as I’ve closed a morning wandering around some discriptions of new ‘useful’ indicators, this article pops up. Keeps my feet on the gound again. Thanks a lot for that.
Great article Nial,
So easy to see everything without all the lagging indicators?
Keep it up man !
Cheers!
Indicators have robbed a lot of money from traders. But, the irony is, we keep on looking for more indicators because that’s the way “gurus” in many prestigous forex seminars told us. Market does not know mathematics, leave alone complicated mathematics. Prices go up and down according to sentiment and this sentiment is translated into candlestick patterns. And Nial has shown the truth of this principle through his price action strategy. Thanks Nial.
Excellent, very well researched article as usual, Nial!
Very useful as a reminder not to overcomplicate our trading.
Thanks!
Mick
Nial, your article regarding pure price action hits the nail squarely on the head.
My method of trading involves candlesticks, pivot points, trend-lines (where possible) and just one EMA, which I use in a similar fashion to yourself.
It’s a simple, clear-cut, RELAXING way of trading. Keep up the good work, mate.
Great stuff nial. For the past months I have been going through your website and training notes and videos and it is just awesome. I have made some good money from what I learn. I can’t wait to join your course and forum soon.
Cheers mate.
Very Clear. I just have been frustrated too much by following the oscilators.
Well done budy.
Nial
I have heard that a lot of people trade off Fibonacci levels,
so much so, they become self-fulfilling!!!
Any thoughts, or should forget these too?
In trends, I use the 50 to 55% area to trade pull backs with confluence, but i don’t really use traditional fibonacci at all.
Nial
common sense, great article, I need to join.
Hi Nial,
I just found you and your website. I jsut want to thanks you for all of your shared experience and hardwork for your job. I think your article is the thing I was looking for because I am so tried of losing money based on the method of using indicators and I was tring to find an indicator to confirm the support and resistance to enter the market. My sterategy is the same you are teaching: using S&R and trend but I worked with some indicators which confused me because someimes they worked fine and sometimed not.
the thing is after all of testing indicators I didnt understand why they sometimes fail and sometimes work. beside they made me confused when I used them as multi time frame.those indicators made me frustrated trader. But since I put them out I see the market in different view.
But I know the S&R and trend.I think I need some confirmation of something else to enter the market.I guess I can use your method to be successful.
thanks nial for this fabulous article,really after studying your writings my trading method has been completely changed,now i am continuously proceding towards profit side. thanks again.
Neil, you always tell things in trading which has logic and understandable to reader,thanks
THANKS NIAL
Nial
Great stuff as always. I am a recent convert to this style of trading and have just found your site. I must say your material is probably the best I have seen.
Your lessons are fundamental, basic and esential to form a strong foundation for trading succesfully, thank you very much Nial!!
Excellent comentry. Price action, support/resistance, trendline breaks, Candlesticks, all makes good common sense.
Go Price action!
Great Master !!! Thank you !!
Outstanding presentation of the facts Nial – Thanks. Anyone who does not own your course ought to know they are delaying their trading skills each and every day.
Folk; any indicator you use, you are taking away/getting away from the PURE PRICE ACTION! Why reduce your chances of success?
I like your approach very much. I started my practice trading with your style at that time I didn’t known too much about indicators. Known I am known with them.
Thanks for yet another nugget of wisdom Nial. Now that I’ve mastered the pin bars, inside bars and fakey set ups. I have had much more success trading and so much less stress!!! Which keeps the psychological side of my trading in check! Can’t thank you enough!! Paying for the course wa sthe best investment I’ve made in my trading journey hands down. It has more than paid for itself tenfold! Keep the lessons coming because no one else is telling it like you Nial! :-)
cool article ! give up indies a looooong time ago
I’ve been through it all. Naked charts, support & resistance, and price action reading is the ticket to consistency and long term success! Thank you Nial.
Very well explained Nial.I really enjoy reading your articles and looking forward to joining your course.What really strike me is that as you said indicators are like middleman.If we can by direct from the producers,why not.It’s more profitable isn’it.On a lighter side I think ‘charts’ are like women, it’s best to see them naked,ha,ha.Thank you.
Understood, as always you make it easy to understand. Thanks Nial.
Mr. Fuller
I don’t know nor care how people can be successful with the use of indicators but they are none the less. I like “Price action”! I rather like what is unfolding before me now as the candle forms and closes then five or more candles down or up the line.
Your student
Great wrtie up!
I really agree that price action works. And learning to read it although takes a lot of effort but well worth it.
Nial material is practical.
YOU ARE JUST A GENIUS,THANKS NIAL,I CANT WAIT TO ORDER FOR YOUR COURSE BUT I WANT TO KNOW IF I CAN APPLY THE DAILY TIMEFRAME ANALYSES TO MY INTRADAY TRADING? I USE 1HR AND 4HRS.
yes you can.. but i prefer 4 hour and daily
After going through all the great free content that you give, I decided to take up your discount offer and I am currently sifting through all the course info. Glad to be onboard with price action and not clutter my screen with indicators.
Your article is really spot on. As a newbie that exactly what I have observed as well. Some of these indicators only cause you to miss important trades. As soon as I get some money I intend to join your group. Cheers.
Nial, where do you get your charts from? Thanks Jayne
email me for that Jayne. I wont post a link here.
Nicely done.
Good and insightful article.i have being a toy in the hand of indicators for long time before i was rescued by you.The best approach the market is first hand data through price Action.Nial keep them coming.you are a great Mentor……………..
Nial,all I can say is thank you.You’re a great mentor,your trading style is simple,but highly effective,if one chooses to follow and apply your rules.My trading got off to a very slow start,I’ve been following you for about a year now and slowly but steadily I’m beginning to see an improvement in my trading with more winning trades than losing ones.This is simply because I’m following your “naked chart” trading price action only method.
I am having great success with the price action taught in the course.
Regards,
Rick
Thats the current chart of EURUSD with bearish signal up there :) I agree, much visible onan naked chart… I still use Bollinger bands though, have to get rid of them over time…
Nial
I am beginner trader and am reading up on everything I can get my hands on. There are a lot of conflicting messages I can tell you.
I like your clean, simple-is-best approach and I like your writing style which is clear and precise with a bit of humour here and there. I find it easy to read your stuff and learn something each time.
I am at an early stage in my trading journey but am already getting analysis paralysis. I have burned a fair bit of money in course costs, books and minor trading losses.
The biggest problem I am wrestling with is whether to pursue a multi day trading approach with big returns like yours or an intra day scalping approach which suits my small account.
I would be interested in your opinion if you have time to get back to me.
Best regards
Grant
I can’t tell you what to do, you should just be aware, that intraday trading on smaller timeframes can be riskier. I prefer trading daily timeframes as discussed in many of my articles and training. You should explore my content more.
Hello Neal. A great article. I teach tax law for a living and, after many years of experience,I know when I meet a fellow teaching professional, but then, I believe you already know how good you are. Your material is fantastic and you really ought to write a book to include your material. Just one thought, however. Do you see any merit in expanding your material to include fibonacci since I am positive with your skills you could make this minefield more accessible to dummos like me
Thanks for the comments guys
Nial, i have for a long time believed the very same thing, indicators are useless. Great reading this, it backs up what I already feel and believe, thanks, Frank.
Absolutely Amazing Article dude.. I love reading your lessons. Peace
This article was “ground breaking”. Nial your a genuine help to my trading and my thoughts about the market. I wish I had found your site a long time ago. I am going to join your group later in this month. Thanks again. Antonio
Hi
Yes I was one of the traders with every indicator on the screen that I could fine.
Not any more.
Many, many thanks.
Have a great trading day (it is very slow at the moment just gone 10.00am gmt)
Don
Hi Nial,
I have removed all my indicators and I can seee the chart way much better I even make the background like yours white. I will order your course very soon …