The Difference Between Price Action Event Zones and Support & Resistance Levels
 Two of the primary features of any price chart that are critical components for any price action trader to thoroughly understand, are support & resistance levels and price action event zones.
You are probably more familiar with “support and resistance levels” since they are one of the more basic technical analysis concepts and are pretty easy to understand.
However, price action event zones (also called event areas) are something I came up with years ago and so they may be a bit less familiar to you. But, they are equally as important as standard support & resistance areas, if not more.
In today’s lesson, I wanted to take some time to teach you about both of these pieces of the technical analysis ‘puzzle’ as well as assist you in differentiating between the two.
An elephant never forgets, neither does the market…
Elephants are said to have one of the best memories in the animal kingdom. The market, also has an amazing ‘memory’ in that major turning points on a price chart tend to carve out levels and zones that remain relevant for months and years into the future.
How many times have you seen a market turn, virtually on a ‘dime’, and then you zoom the chart out and see that same level was also a major turning point multiple years ago? THESE are the types of price action ‘footprints’ that we NEED to learn to follow and utilize.
Whilst I have written an article about event areas before, titled The Market Never Forgets, I want to reiterate exactly what these important areas on the chart are…
An event area (or zone) is a significant horizontal area on chart where an obvious price action signal formed OR from which a massive directional (up or down) move initiated (such as a massive sideways trading range breakout, for example). You can and should think of these event zones as a “hot spots” on the chart; a significant / important area on a chart that we should continue watching carefully as price retraces back to it in the future. We have an expectation that next time / if price re-visits these event zones, the market will AT LEAST pause and ‘think’ about whether or not it will reverse direction there.
- Event zones are key price action signal areas or major breakout zones from a key level or consolidation.
- Support & resistance levels are obvious horizontal levels that are drawn on a chart connecting bar highs or lows that are at or near the same price level. These levels can remain relevant on the chart for days, weeks or years, but they are, overall, less significant than price action event zones. See my tutorial on how to draw support and resistance levels for more.
Price Action Event Areas
As discussed above, a price action event area will remain relevant well after it forms. If a market comes back and re-tests these areas, they provide a “hot spot” and a good opportunity-area to look for a second chance trade entry. So, don’t worry if you missed the original move from the event area, there is usually another opportunity at an event zone and the market will be there tomorrow, don’t forget!
Large and significant events / moves on the price charts are remembered and other professional traders know this. These past event zones often become self-fulfilling turning points simply because so many other traders expect price to turn there and are already waiting to buy or sell at them.
Let’s look at some example charts…
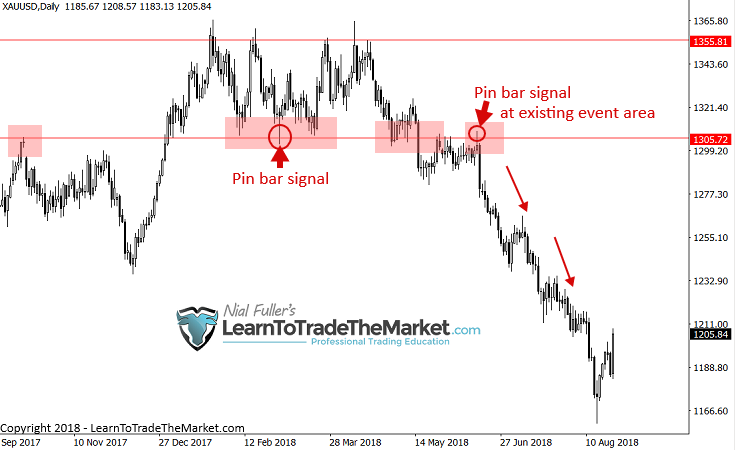
Perhaps the easiest way to understand a “price action event area” is by a clear and unmistakable event, such as a pin bar signal. If an obvious price action signal forms and price follows-through in agreement with the signal, making a strong move, you now have an event area at the level / area of the signal’s formation.
An important point to remember about this is that if you miss the original event move, don’t worry! You can often get a second chance entry by simply waiting for price to retrace back to that same event area. You don’t even need a price action confirmation signal on the retrace either, you can enter blindly at an existing event area. However, if you do get another clear price action signal on the retrace, as in the example chart below, it’s even better!
The event area seen below through 1305.00 in Gold, was solidified by both a signal and a breakout. Notice the first pin bar signal on the chart just above that level, then price eventually broke down through 1305.00, breaking out, further hammer-home that this level was a strong event level.
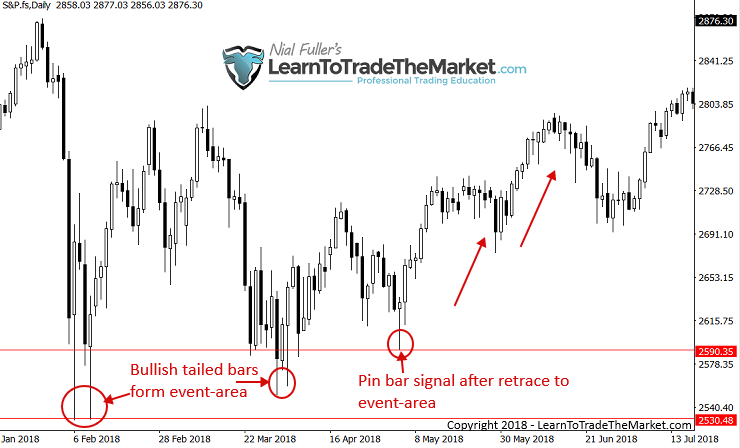
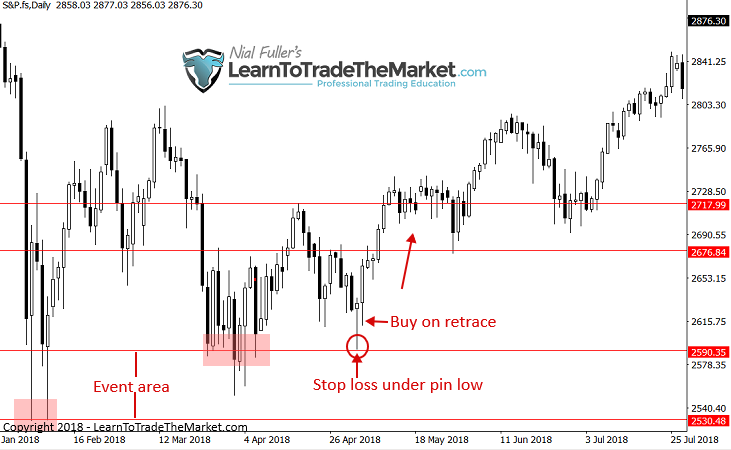
In the next event area example, we are looking at the S&P 500 daily chart. Notice that after a powerful down-move, a couple of long-tailed bullish reversal bars formed in early February, leading to a powerful up-move. The event-zone was forged at that point. We now can watch that area as a “hotspot” on the chart to watch when price pulls back to it again.
Notice the pin bar buy signal that formed after a pull back to that event zone. This was a near picture-perfect buy signal because we had the confluence of the event-zone as well as a well-defined signal.
Support & Resistance Levels
Support and resistance levels are simply horizontal levels on the chart that can be drawn across bar highs and lows. There can be many support and resistance levels on a chart, so we mainly pay attention to the more significant ones.
I’ve written several tutorials on how to draw support and resistance levels as well as how professionals draw support and resistance levels.
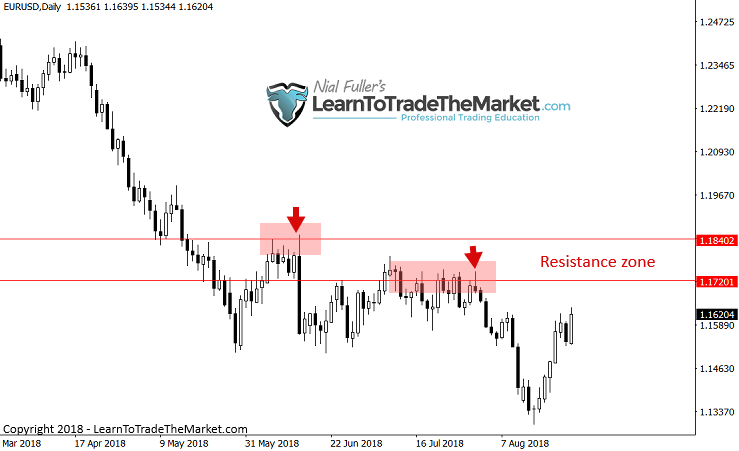
In the example below, notice there is not obvious price action signal and no strong breakout from consolidation or a level. These levels are just standard support and resistance levels being drawn in across bar highs and lows.
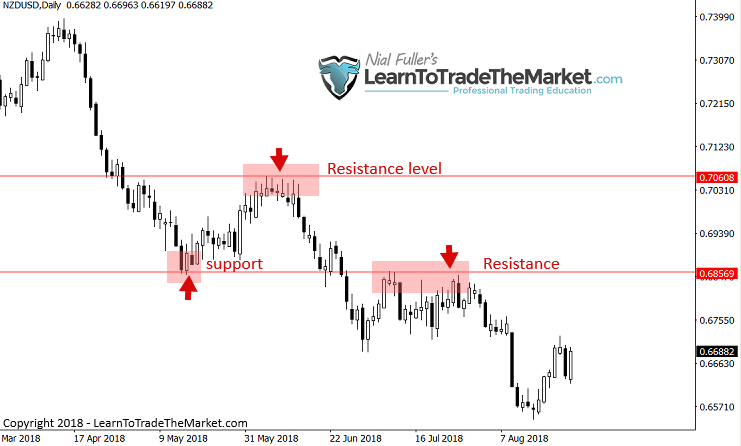
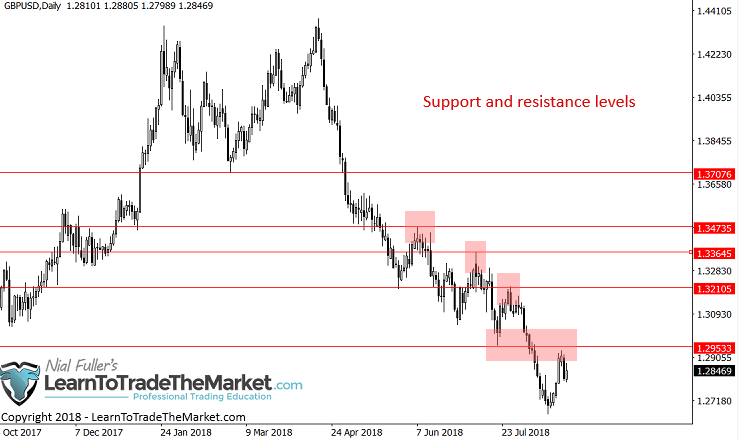
There are usually many more standard support and resistance levels than event zones on a chart, even on a daily chart time frame / higher time frame. The main point to understand about this fact, is that event-zones are more important since they reflect a major price event, whereas support and resistance levels can be drawn across smaller market turning points that are typically less significant. See example below of standard support and resistance levels.
What are the main differences between the two?
The difference between an event zone and standard support and resistance level or area can seem quite subtle, but there is a distinction.
The easiest way to put it would be, every event-zone is also a support or resistance level / area, but not every support and resistance level is an event zone.
Here’s how you can differentiate the two…
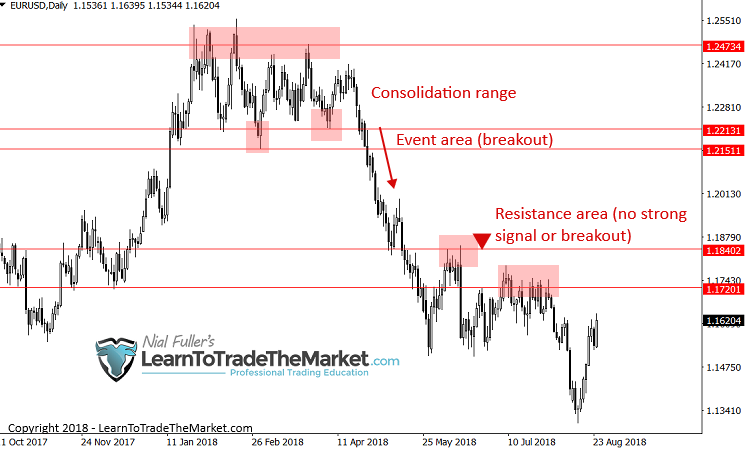
An event zone has to either have a price action signal that led to a big move OR a major price breakout from a consolidation area or level. Let’s look at some chart examples to show this more clearly:
Below, we see a clear example of an event zone, it was an event zone because:
- It was the area on the chart where a major breakout occurred. Notice the long consolidation range before the breakout. Hence when that breakout finally occurred, it was a powerful price action “event”. This level on the EURUSD chart will likely remain relevant well into the future.
Next, we see a clear example of support and resistance levels drawn on a chart. These are not event areas because:
- There was no long consolidation preceding a breakout.
- There was no strong / vivid price action signal that kicked off a powerful move from these levels.
Event zones and support / resistance levels help define trade risk
Another important feature and benefit of event zones and support and resistance levels is that they help us define our risk on a trade. More specifically, they help us determine where to place our stop losses and how to know when the market has invalidated our trade idea.
You can obviously place a stop loss just beyond a support or resistance level, because if price violates that level, the thinking is that the market is changing and your original trade idea is now unlikely to work.
An event zone is often a more significant support / resistance area so it’s an even better barometer of trade risk than a standard level. If a market breaks past an event zone, you KNOW your trade idea is not working and market sentiment is severely shifting.
If you have a clear price action signal / pattern at an event zone, you can fine-tune your risk even more, because these signals are often very-high probability and hence we can place our stop loss at the high or low of the signal and often we can then enter on a retrace of the signal, on what I call a trade entry trick, which allows for huge potential risk reward trades:
Conclusion
Becoming a proficient price action trader is all about learning to skillfully interpret and properly utilize the footprint of money on the chart, this footprint is left behind as the price action plays out over time.
There are various ‘tools’ in a price action traders toolbox and the tools that I teach in my professional trading courses are (obviously) what I feel are the most important ones. Price action event zones as well as standard support and resistance levels are just as important as learning individual price action signals and patterns. Event zones and support and resistance levels play the critical role of helping you to understand the overall chart context and market dynamics that a particular trade has formed within. It is THIS interplay between the actual trade signal / entry itself and the overall market conditions it forms within, that constitutes a high-probability trading opportunity. Not simply “Oh, there’s a pin bar, I will trade it”.
It can take years of screen time and experience to fine-tune your ability to understand and properly trade with all the different pieces of the price action “puzzle”. However, learning from tutorials like this one as well as getting a more structured price action trading education will go a long way in reducing the learning curve and shortening the time required to become a master price action trader.
I REALLY WANT TO HEAR YOUR FEEDBACK IN THE COMMENTS BELOW :)


Thank you for sharing best information
I’ve been in this business for quite some time,but since i started reading and following trading lessons,i see the light at the end of the tunnel,and for that matter you’re the best.
thank you nial ,before reading your article i am a big losser .
Now i trade daily time
I have been learned your lessons for about two years,erery day erery week waiting for your new lesson .
I feel lucky that you exist to help us learn all this materials for free……GOD BLESS YOU ENDLESSLY NIAL.
You are amazing, all these golden resources for free.GOD bless you Nial Fuller.
Great learning Sir best article and last lines also (reducing the learning curve and shortening the time…)
Great here again! Once again, your article solved the problem for me. Since I have been reading your articles and put what I have learnt into practice, my trading system has greatly changed. Thanks Nial. You are the forex saviour sent to save someone like me from the hand of that tricky and fakey market bias.
Superb!This is the core concept.
Great article, Nial!
This is what I’ve been looking for a long time.
A great addition to my candlestick trading system.
I have been struggling to get on to something u can lean on about this Forex of a thing, here you are like a saving angel from heaven. I can now stand a chance of winning most my trades unlike before, your articles are the most rich and valuable materials I ever read regarding Forex trading, for that God bless you for us amateurs. Will soon join your professional training course soon Sir. Thank a lot
It’s always usefull and refreshing to read your tutorials. Thank you so much!
Nice article Nial
Thank you for the lesson. I really like the low risk, high reward potential of catching a good retrace. I tell all who want to trade about your course. Thank you so much!
Another excellent observation you have ever made
Yesterday l read the same article in the professional course that l subscribed under learntotradethemarket.com. This has reinforced the ideas and l hope to successfully trade in the coming year. Been struggling for a while now. One thing l have taken away over the years from your tutorials is trade less on double confirmations.
Another brilliant piece of analysis. Thanks and keep it up! You’re the best in what you do
Thanks coach. This lecture is exactly what I have been longing for.have always Known that there was something peculiar about these areas but this post is a mind opening and I just caught the light now.. Thanks I’m greatful
Thanks Mr. Nial! The main thing not to be lazy!
Great observation. Due deligence is required.
Thanks!
Hello Nial… Words alone cannot express how grateful I am for all this Free Articles you’ve been publishing… My Trading has Improved drastically from a loosing to a winning trader.
Thanks a million coach… Forever grateful.
many thanks for this article Nial!
For some days now i have been going through your site and the price action of a thing does make sense to me.
I have been trading forex for some time unsuccessfully though. The little I can grab here indicates to me that trading forex does not need to be complicated as it’s been portrayed. Thank you for the simplicity in your analysis.
Hi, your website is very much informative and really useful to an amateur trader like myself. Well done and continue doing this artucles cause they really come in handy. I so wish we had people like you in South Africa to mentor us.
Thanks Nial. This was very useful for me.
God bless you with more wisdom Nial.
You are so invaluable. No words to explain your goodness. Thanks a lot
Thanks Nial it is a very good article
very good teknical analysis
Thanks Nial, this is a very helpful article. Especially for to limit losses by stop loss. Besides, if we miss entering the trade it gives us another opportunity to enter.
I bless the day I met you
I now know and understand the event area so much more clearly! Thank you for your invaluable explanation.
Thank you Nial, for identifying the most significant areas of support and resistance – i.e. event areas! I really feel I have learned something of great importance today. Thanks again!
This is the best article to me from the ones I read so far, even from the members area. Very clear and simple explanation of the event area and S/R.
Thanks Mr. Nial.
You say, ‘Trading is a war’.
And I say, ‘Thank you coach for weaponising me so well’.
Addendum:- This knowledge makes me feel so relieved as not to worry about missing a trade at the event area because now I know another opportunity will present itself at the same Event Area sooner or later.
What a powerful tool to have in the arsenal!
I only joined the team recently.
What a powerful explanation of the interplay/ differences between ordinary standard levels and the obvious price action zone areas. To date, I have given both equal significance.
Really powerful stuff.
Many thanks Nial.
Thank you Nial. i have improved my trading strategy so much through your price action tutorials, good job.
Nial Fuller, you are great , your lesson is fantastic, thank God for meeting you.
Thanks for that article! i would like to ask: are these event zones and resistance/support the same as demand and supply zones? Or maybe it doesnot matter in this case?
Thank you for that tutorial Nial. I didn’t know there was a difference between the support and resistance lines and a price action event zone. I keep getting stopped out, so this information will help me with that.
You are unbelievable!!!
Surely no one comes close, great article as always!!!
Thanks yet again!!!
The best mentor ever, lots of love for you and your work
Thanks for sharing yet again a powerful strategy Nial.
woow! thus brilliant
Thanks Nial,
Great reminders, and perhaps a reminder to be, and cultivate Patience.
Many is the time I have entered appropriately in an event zone and then exited far too early, with profits, but far less than possible.
Patience and confidence in what I am looking at.
Many thanks, cheers, james.
What an aha moment,now it all make sense. I always appreciate your articles and learning a lot from them.
Want to be a member as well
Great reminder Nial- appreciate the other articles linked to this as well
Wow, that really made so much sense and made it so much easier to ‘see’!
Thank you for another ‘Aha’ moment for me.
thanks a lot
Thank you dear Maestro.
Now I understand why event areas/zones are much bigger factors in determining high probability trades and high Risk Reward trades than support/resistance levels.
Safest regards to the LTTTM team.
Thank you Nial
As usual, fantastic article,
thank you Nail very great lesson and it makes sense !!
Nice and very educative article. Thank you very much for this update.
Technically the event areas are called Supply and Demand, is exactly where the Market Makers enter and exit the Markets, and where the retail traders are losing due to tight stop loses. Are the zones where the Stop Hunters are making the money!
Excellent lesson champ and thanks for your support.
excellent! help me with your trading strategy????
By adding event area you have added third dimention to give it depth, it will definitely help in honing the skill.
Very clear and helpful Nial making the journey to improve daily easier.
Nial Fuller , thanks for sharing your wisdom , the only thing i knew was the S&R levels .
Good that you stress the importance of price signals at event areas/suport and resistance, rather than trading every pin bar that comes along regardless.
Thank you very much using your information with Richard Wyckoff Theory good match
ı agree with you, Nial makes it more powerful
I agree with you, Nial makes it more powerful
Yet another brilliant piece of wisdom!!