9 Professional Insights on Drawing Support and Resistance Levels like a Pro
 I get emails almost every day from people asking me questions on how to properly identify and draw support and resistance levels on their charts. This tells me there’s a lot of confusion and probably misinformation out there about support and resistance levels and how best to draw them.
So, in this lesson, I want to give you guys my professional insight into how I approach identifying and drawing in support and resistance levels by giving you 9 easy tips to use…
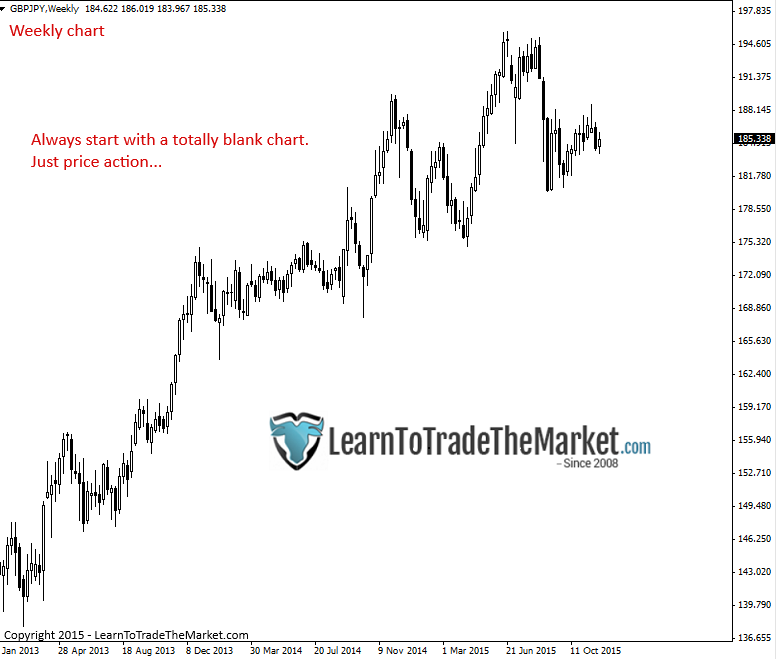
1. Remove EVERYTHING but the price action from your charts
You don’t want anything distracting your eye when you’re looking for the most important support and resistance levels on a chart, you want the clearest and ‘purest’ view of the chart you can get. For this reason, I take off any moving averages that I may use on my charts and I HIGHLY recommend you do too.
As you already know if you’ve followed my blog for a while, anything other than a couple moving averages should not be on your charts anyways. If you don’t yet know why, then please read my article on why indicators will destroy your trading account.
Just remember: A clear chart with only price bars (candlesticks) is going to give you the best view of the market and the key levels you need to find and draw on it.
2. Start at the weekly chart, draw in the long-term levels
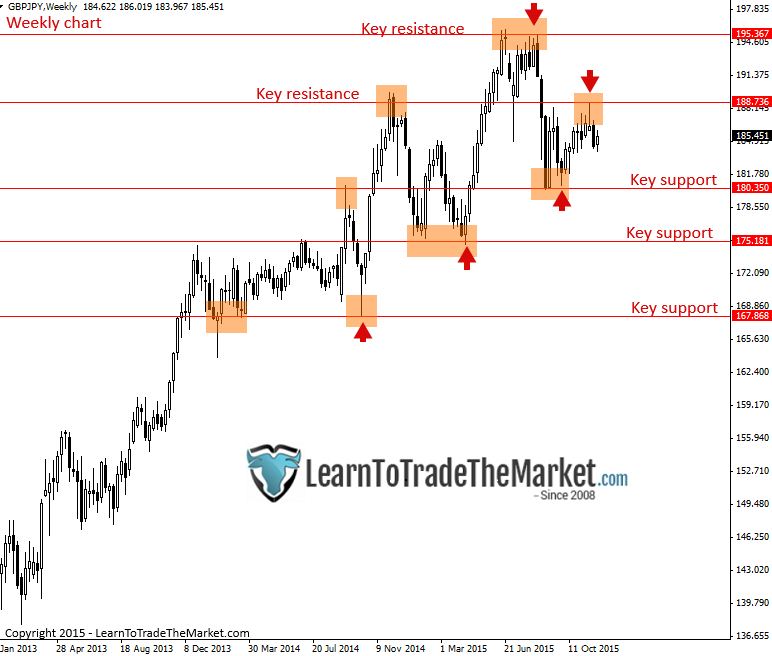
The weekly chart is what I consider the best place to start in learning to draw in support and resistance levels, because it provides you with the clearest view of the most significant long-term key levels you need to have on your charts.
For example’s sake, I am going to take you through how I would draw in the support and resistance levels on the same market (GBPJPY), starting from the weekly view.
You will notice in the example below, I have zoomed out a good distance on the weekly chart (about 2 years) and placed horizontal lines at what are the clearest and most obvious price points or areas in the market where priced changed direction…
3. What to do on the daily chart…
After you’ve identified and drawn in the key long-term levels on the weekly chart time frame, it’s time to drop down to what I consider the most important time frame; the daily chart.
At this point, you are now looking for any obvious / key levels that weren’t clearly visible on the weekly chart and that you may have over-looked. You are also going to draw in any obvious closer / near-term levels. These near-term levels are more likely to come into play than the further out key levels, so they are important to identify and draw in.
Let’s look at an example…
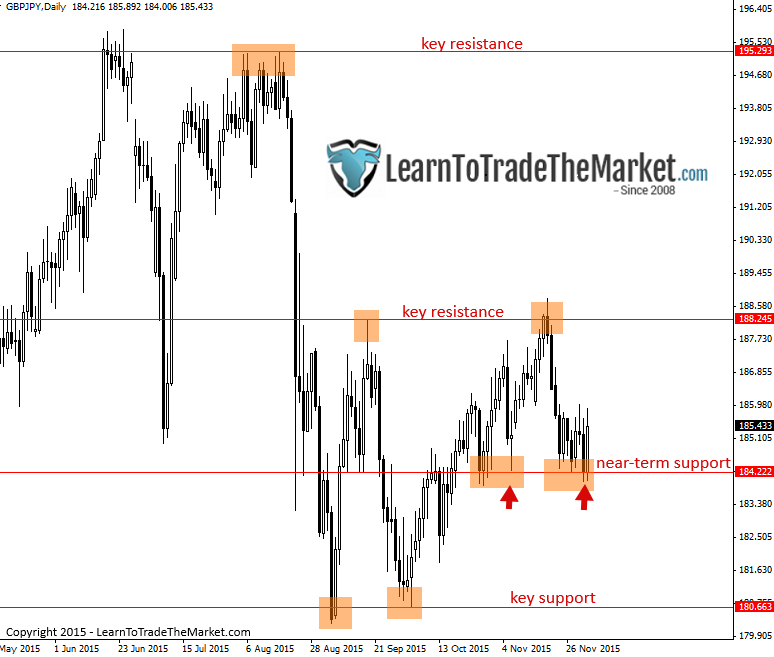
Notice on the daily chart above, I’ve drawn in a new level at 184.22, I consider this a near-term level and notice it was not obvious to me on the weekly, but clearly it’s an important level so I drew it on the daily.
Also notice I’ve adjusted the key support and resistance levels that we drew on the weekly up or down slightly. I did this because after viewing them on the daily chart it made sense to me, based on the position of the level relative to the bar highs / lows, to adjust the level slightly. This is totally fine and you will find that as you view weekly levels on a daily chart you sometimes will see a reason to adjust them slightly as I did in the above example. I am not talking ‘big’ adjustments; if you notice I adjusted mine by about 20 to 30 pips or so.
4. What to do on the intraday (4 hour and 1 hour charts)
The 4 hour and 1 hour charts are going to be mostly for ‘review’ purposes. Meaning, you will review where the key weekly / daily and any daily near-term levels are at, because these levels are very important on the intraday time frames.
Most of the time, I am focusing on daily chart levels as I look at the 4 hour or 1 hour time frames, rarely do I find myself believing I need to draw in any further levels on these intraday charts. But, on occasion, there will be a level or two you want to draw in, more likely on the 4 hour than 1 hour.
Let’s look at an example of this below…
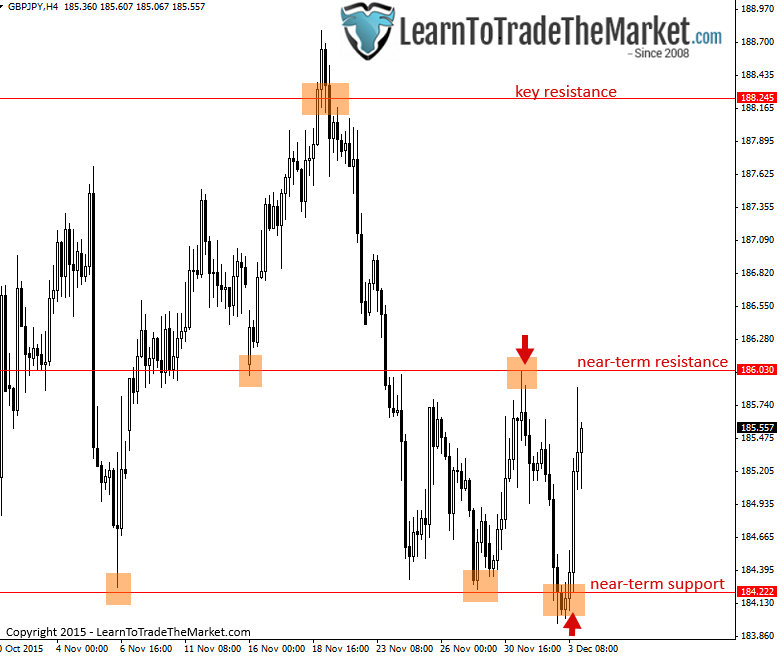
Notice on the 4 hour chart above, I did draw in a new near-term level at 186.03. This level looked important to me from the 4 hour view, that is why I drew it in, but on the daily and weekly chart it didn’t look significant or obvious.
For in-depth instruction on how I trade the 4 hour and 1 hour charts with the daily and weekly time frames, take my advanced price action trading course.
5. The difference between ‘key levels’ and ‘near-term levels’
You will notice in points 3 and 4 above, I labeled some of the daily chart levels ‘near-term levels’. These differ from the ‘key levels’ primarily because they aren’t obvious on the weekly chart and they are closer or ‘nearer’ to the current market price.
A key chart level will typically be obvious on a weekly chart and a large or significant move will have occurred from it, either up or down. Key levels are the most important levels to watch for signals at and to look to trade from, but near-term levels are important as well.
There are obviously some subtleties involved with drawing in support and resistance levels, and this difference between key and near-term levels is certainly one of them. You will need to use some discretion, and you will improve at determining which levels are ‘key’ and which are ‘near-term’ through training, time and experience. One good way to improve is to see how I draw in the levels in my members daily trade setups newsletters each day.
6. How far back should I look for levels?
One question I often get from traders on the email support line, is “how far back should I draw my levels?”
It’s a valid question, and one that is easily answered by simply looking at the example charts above. Notice on the weekly chart I went back about two to three years, and on the daily about six months to one year, the 4 hour and 1 hour will typically be about 3 months of data or less. Keep in mind, these are only estimates, but generally speaking, you don’t need to get back extremely far in time.
I believe that generally speaking, the further back in time you go the less relevant the levels become, so I put more focus on levels over the last 3 to 6 months than over the last 1 to 2 years for example.
7. Don’t cloud up your charts with levels
I sometimes see traders with charts so full of lines that it looks like a 3 year old scribbled all over it. You don’t need to draw in every single little level you see on your charts, you only need to focus on the key levels and the most obvious near-term levels, as I showed you in the examples above.
Generally speaking, less is more in trading and that applies to levels as well. If you draw in too many support and resistance levels, you will begin over-analysing the market, confusing yourself and getting ‘analysis paralysis’. Learning to draw only the most important chart levels, both key and near-term levels, isn’t too difficult and is something you’ll improve at through education / training, time and experience.
8. You won’t always be able to draw the lines exactly at highs or lows
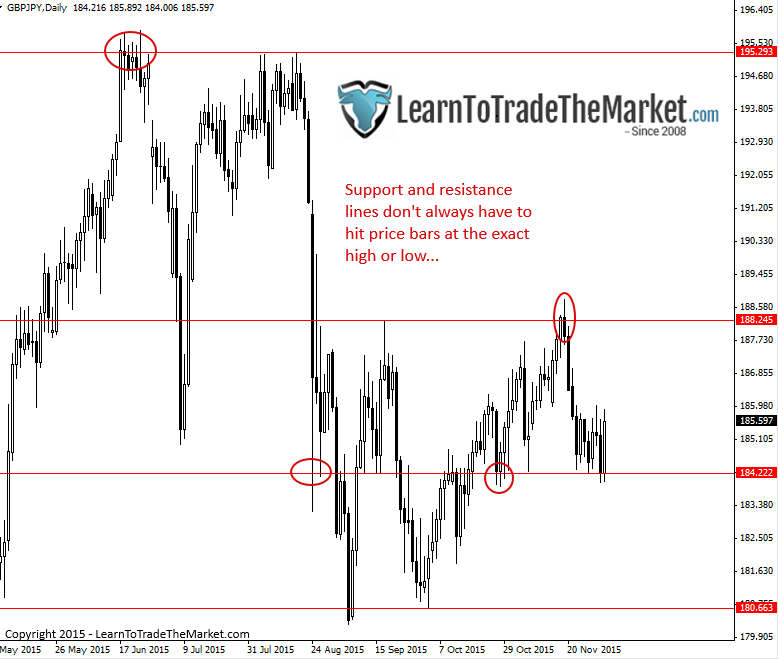
Remember that you don’t always need to draw the line perfectly touching the highs or lows of each bar, nor will you be able to in many cases. Your lines can and often should intersect the body or middle of the tails of some of the price bars they connect
At the end of the day, you need to use your discretion to determine where the most logical place to draw the level is. It might mean you hit a couple bar highs exactly and a couple are intersected through the candle’s body; this is OK.
Let’s look at an example….
9. Support and resistance levels vs. zones
Another key point to remember about support and resistance, is that they often are not ‘exact’ levels. Often, you will want to draw in more of a ‘zone’ of support or resistance, you can think of these as ‘value’ areas on a chart; where price preferred to trade recently and consolidated or stayed at for some time.
This will be easier for you to learn by looking at an example of it, check out this article for some example of support and resistance zones.
The best way for you to learn and to improve your abilities to identify and draw support and resistance, is to take my trading course and follow my daily members trade setups newsletter and see how I draw the in the levels there. After you do this, identifying and drawing in the levels will become second-nature for you.


Fantastic lesson. So clear to understand and follow. Thank you so much.
Thank You!
thanks you. it’s great.
How do you know where resistance and support are important?
Thank you so much for this insight. It is really helpful. Line chart has been helpful in solving the problem of highs and lows at key support and resistance area. I usually load my line chart and watch out for bend areas on the higher timeframe, D1 in particular. The line chart simply connect the closing prices, and it filters out open, high, low.
Thank you so much.
Thanks a lot, this is one of the best articles I’ve ever read about mastering support and resistance levels.
Good staff. Thanks!!!
Very informative and helpful. Exactly the information much needed. Great article. Thank you.
Thanks for the Great Post!
May God Bless You and Your Family!
Amin.
u r the boss of all master….may God bless u……
I think that in order to achieve better clarity while drawing levels, it would help if the near term levels are given a different colour….possibly green/blue.
You see… the mind has got a way of looking at things.
very much so i find that the best way to identify key and near term levels
tanx Nail really appreciate it
Very usefull info.Tq
Thanks Nial,your articles always help me a lots. Actually I am a stock trader but read your articles educate me in charting and psychological.
Fantastic way of educating people,I adoff my hat Neil, keep it up. I think I agree with u about learning the process before talking about getting rich.
Regards
Olisa Nwadiogbu
I like how you teach us The Art of Trading as well as the Science of Trading. Brilliant article Nial.
Thanks Nial. Very simple … Very useful .
How to undrestand and use dynamic SR.
thanks Nial for the information..it’s really helpfull in my trading..
Thanks Nial,this was an area I needed to understand better. And now I do!
Thanks again nial,always on point
Espectacular Nial !!!
Nice one, especially point number 7. BTW, do you draw this S/R level everyday or just the beginning of the week (Sunday afternoon) and just adjust daily according to the market condition
Adjust them accordingly as market conditions change.
Thank you very much. Every time a good lesson! Thank you :)
This is good stuff. You think you know it, but when you read it again you get a deeper insight – another layer into the onion.
Thanks Nial
Thanks for information Nial,i’m confused as to what is the difference betwixt supply&demand levels and support&resistance if there is one
what about dynamical levels? are they useful?
Hey, if you mean dynamic as in ‘moving averages’, they re useful in the right context (especially in an established trend). Dynamic levels are usually something I combine with a price action signal (confluence setup), I expand on this concept in my education courses.
i am thinking that in your everyday chart, you dont use MA, but a clean chart with couples horisontal line. If there is a setup, you will add this EMA 21 temporary just to add up as confluence. then you will remove the MA gain, am i right?
Nial,
Great article. Very enlightening. Keep posting and Enjoy your chrismas
John
thumbs up! Well done article. I have easy to understand levels clearly marked with color.
I like the lessons so much but I started in the middle of it. Hope I can get to start from the beginning to the end as I am a complete novice.
Really useful information Nail
Thanks Nial. Great insight as always.