Trading From ‘Event Areas’ – Second Chance Trade Entry Strategies
 In today’s lesson, I’m going to share with you a very powerful trading ‘tip’ that will significantly improve your understanding of price dynamics as well as how to read a ‘naked’ price chart.
The ‘tip’ is somewhat simple on the surface, but a bit more involved when we dive down a bit, and that’s the part I’m going to help you with today. What I’m talking about is the tendency of a market to never ‘forget’ where a major move started.
How many times have you seen a market retrace back to a level or area where a recent major move started from, only to respect that level almost exactly before making another strong directional move? It happens often enough to be something that you need to understand and know how to make proper use of, because these scenarios can often yield very high-probability / high reward to risk trades.
Let’s hit the charts for an explanation of this powerful trading technique
Before we proceed, it’s important to note that what I’m about to discuss with you is not a ‘perfect science’, but it’s an occurrence in the market that is critical to understand, and a tool to have at your disposal when you’re analyzing charts.
The first point you need to understand is: A market will often ‘remember’ and respect where a major move started. That is to say, if a market retraces back to the level or area a major move started from, many times (not every time) it will again bounce or fall away from that same level / area. As a price action trader, this is a HUGE clue for us and we can use it to develop several high-probability entry techniques:
In the example chart below, we can see a few important things taking place.
1) A key resistance level was established near 9735.00 – 9700.00 in the DAX30 market (German Stock Index). This key resistance level and the big move lower from it established an ‘event area’.
2) The first major test of this key level / event area a little over a month later, resulted in a bearish pin bar sell signal that led to another large decline.
An event-area is something I teach more in-depth in my course and members area. For our purposes here today, you should know that an event area is a level or a small area / zone on the chart where a big price move started from. A price action signal by itself can start an event area, it doesn’t have to be at an existing support or resistance level. However, if a big move starts from a price action signal in conjunction with a key level of support or resistance, this is an even stronger event area.
3) The next important thing to note on the chart below was that as the market tested the event area when the pin bar sell signal formed, it reversed yet again, because the market didn’t ‘forget’ about that event area…
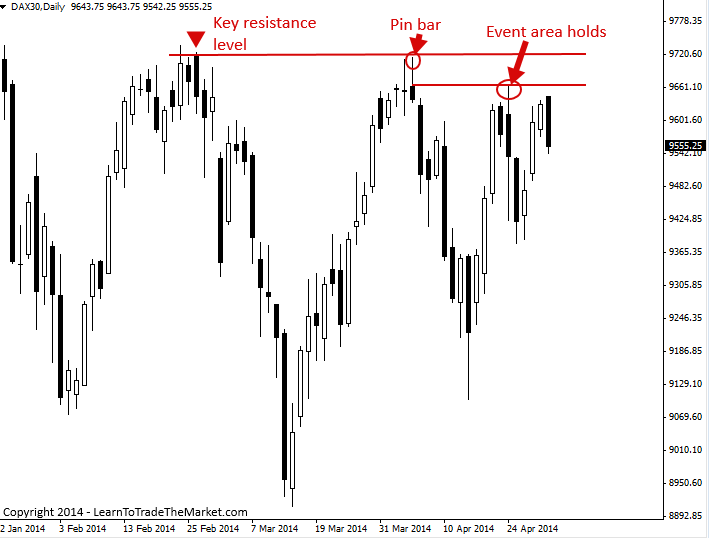
In the above chart, not only could have we traded the pin bar sell signal from the key resistance level / event area, but on the subsequent test of that event area, we could have taken what I call a ‘blind entry’ at the event area. The entry would have basically been a limit sell entry somewhere in the range of where the pin bar formed, with a stop loss set just above the resistance near 9714.00 / pin bar high. This is called an ‘anticipatory’ blind entry at an event area on a retrace, or sometimes I will call it a ‘second-chance’ entry.
Note: A price action signal at a key level or event area is a bit ‘safer’ of an entry technique than a ‘blind entry’ because it gives us some ‘confirmation’ for an entry, but as price action traders it’s important to be able to read a chart and understand the dynamics of event areas, because we won’t always get the price action signal when we want one. Thus, as you gain experience you can try to enter ‘blindly’ at one of these tests of an event area, I also sometimes call event areas ‘hot points’ in the market as they are important ‘hot’ areas where a significant price action event occurred recently.
Let’s look at some more examples:
In the chart example below, we can see a good example of how to use an event area both with and without a price action signal as the entry trigger.
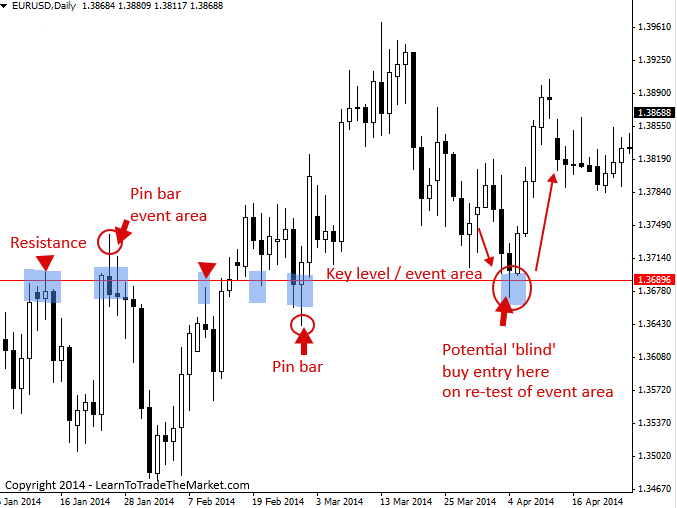
Note the first pin bar on the left of the chart, this initially formed the event area because of the strong down move that followed. So, we knew this level / area near the pin bar would be important on subsequent tests in the future. Sure enough, price has respected this event area on each subsequent re-test.
The pin bar buy signal from February 27th would have been a very obvious trade since it was rejecting and false-breaking down through the event area and price had bullish momentum behind it at that point. Note the nice up move that followed.
Next, when the market retraced all the way back down to the event area on April 4th, we could have successfully entered long on a ‘blind’ limit buy entry near the event area, note the powerful up-move that followed over the next four days.
Now, let’s look at another example of how a recent event area clued us into a potential ‘blind’ or price action signal entry.
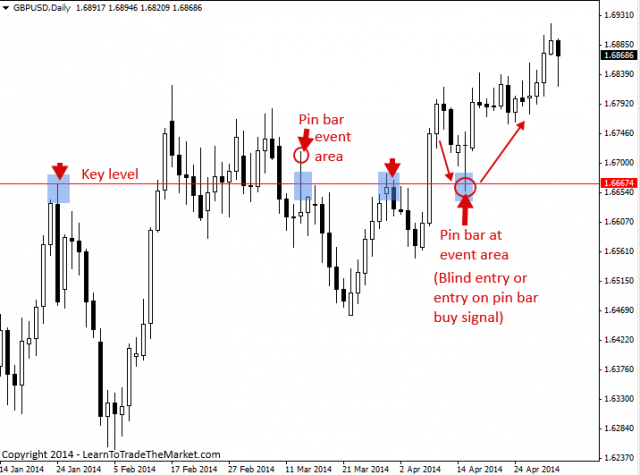
Note, the key level near 1.6670 area on the GBPUSD and the big move lower that started from that level on January 24th, this big move told us that this was a level the market might not ‘forget’ (event area). A long-tailed pin bar sell signal formed here on March 13th, this price action signal and the move lower from it further solidified this level as an event area. Note, how the market then fell away from that level as price sold lower from the pin. We then had another re-test of the event area that led to a modest move lower before the market surged up above the event area. Now, as the market retraced back down to the event area, you would have already known this level was important and an event area (now you know for future reference).
You could have entered a blind buy limit near 1.6700 – 1.6670 area, or you could have waited to see if a buy signal would form. In this case, a very nice long-tailed pin bar buy signal did indeed form and price is still moving higher from it as of this writing. I also made a video of this buy signal when it formed, you can check it out here.
Hopefully by now you’re starting to see how the market ‘never forgets’ about key chart levels and event areas. Once you get more experience and familiarity with these levels, your eyes will begin to instantly be drawn to them on a daily price chart, and you’ll start to feel more confident in your ability to analyze and trade with just raw price action and levels.
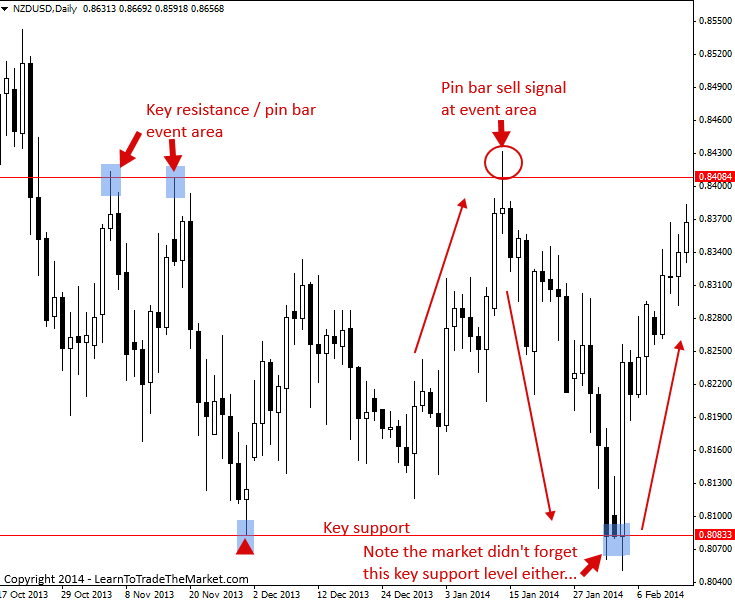
This next example was a pretty easy one to identify and one that we first discussed in our January 14th commentary. In November of 2013 we had two pin bars in the NZDUSD carve out an event area up near 0.8410. As price retraced back to this area in mid-January of 2014, we would have already had this key resistance / event area drawn in on our charts and our attention would have been focused on it as price drew closer. Not only would a blind sell entry have worked as price hit that 0.8410 event area, but we also got a nice pin bar sell signal for further confirmation that a move lower was probable.
We can see the market fell all the way down to the key support near 0.8080 after breaking down below that event area pin bar from January 14th. Note, how well price respected that key support and that the market ‘didn’t forget’ about that level either. I’m telling you guys, this stuff is POWERFUL!…
Let’s take a look at some more examples so the idea crystallizes in your mind…
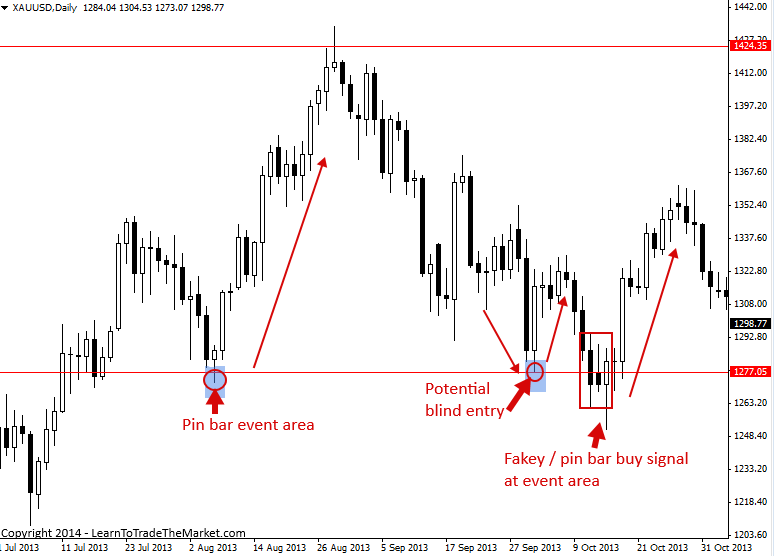
The daily charts below both show the spot Gold market, one of my favorites to trade. You will notice in the first chart below, a key level / event area formed through about $1277.00. Note the small pin bar on August 7th of 2013, the pin bar and subsequent powerful bullish move from it told us that this $1277.00 level was an event area to keep our eyes on if price re-tested it in the future.
We can see price did re-test it on October 2nd of 2013, and a blind buy entry would have worked well here with a tight stop loss just below $1277.00. However, had you missed that entry or been waiting for a price action signal to ‘confirm’ your entry, a clear fakey buy signal formed on October 15th, just a couple weeks later. This fakey signal at the event area led to a nice push higher.
Now, here’s where things get even more interesting…
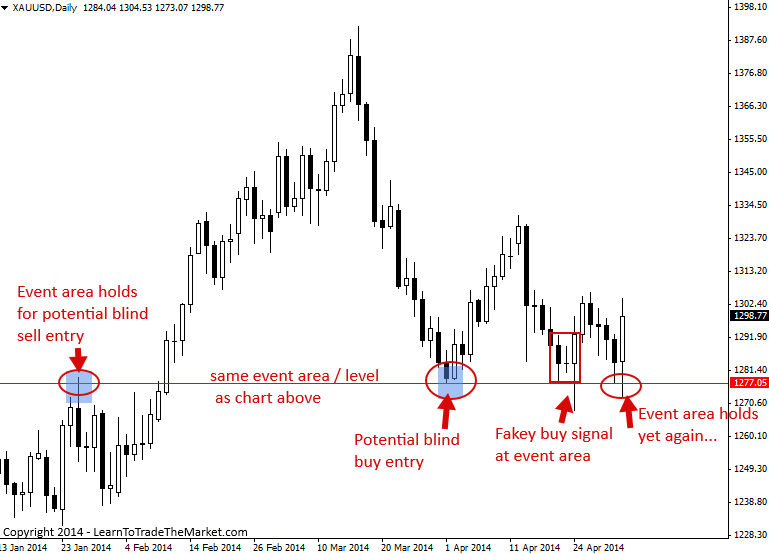
The chart below is also of Gold, and we are looking at the exact same event area from the chart above, just more recently. This $1277.00 level has been an important level and event area all the way back from that pin bar on August 7th we discussed in the chart above.
Now we are looking at about the most recent 3.5 months of daily chart data in Gold, and we can see this $1277.00 event area is still in-play and working quite well.
Note that since the start of this year price has tested this event area 4 times and each time the level held, at least initially. Most recently we had a fakey buy signal from this event area which formed April 24th and that we discussed in our April 24th commentary. Just today (May 2nd), the market tested this event area at $1277.00 yet again and it held yet again…we will wait to see how this fakey signal from April 24th plays out, but the power and effectiveness of event areas and key chart levels cannot be disputed as you can see by today’s lesson!
I hope you’ve enjoyed this brief lesson on key levels and event areas. It’s clear upon observing and analyzing the raw price charts of a market that the market truly ‘never forgets’ where major moves started. By learning to spot these key levels and event areas, we can mark them on our charts and when the market starts approaching them on a retrace in the future, we have a high risk/reward scenario setting up to pay close attention to.
I suggest you first learn to trade these second-chance entries at key levels and event areas with a price action signal as a ‘confirmation’ / entry trigger, then as you gain experience you can try the ‘blind’ second-chance entry we discussed here today. For more information and training on key levels, event areas and my proprietary price action trading techniques, checkout my members’ courses and trading community for more information.


Stealth trading 🚀✨
Good info and great and clear explanations!
Wow there is something different every time I look at it
Good trading ????????
????????????❤️❤️❤️
Nial you are the man. When at first i came across your blog, i never paid attention since i was gambling and ended up blowing my account. Until the day i was searching for pin bar trading strategy and again i came across your blog. Since then, 3 weeks ago you have made me a trader and have since started seeing a turn around on my demo positively. Thank you and may you live long Sir.
Very clever,simple and easy to underestand.Thankyou & god bless you
The best I have seen so far
I thank God the day, i found your post. Have really learnt a lot from your platform. You’re the ‘Best’.
Hello here again, my friend, I am so dumfounded over the way you tried to nail the bull at the head here again. Every time I read your post, it gives me more confidence for trading; my morale is always boosted by your way of analysing the market movement in such a clear and concise manner. Thanks a lot for this. I came to refresh my brain with more ideas, and I am really blessed reading this indispensable article here.
Hi Thanks
Best Regards
Rossen Dimitrov
Strong article! It is necessary to study it properly. Thanks
God will bless you for me.you will have help anytime you need one.you have been a tremendous help to Me.you are God sent to me and I appreciate you.thank you.Kareem
Hai nail
Thank u so much for this valuable information. …one small doubt could u plz tell me what is ment by event area…in simple form plz….
If you haven’t bought the LTTTM course, you are missing out a lot. That’s all I can say. Thank you My Mentor
Very great lesson Nial… I am absolutely enjoying your lessons and practicing what I am learning… And you are correct IT WORKS!!!
From all the trading methology andout there Nials methods are distilled down to simplistic perfection, his articles reflect this and are beautifully written. From all my research (not indicators), and failed trading using pivots theory, Elliot waves, wyckoffoff theory, VSA, Nialls method concentrates the essence of trading in an easy to use way- the difficult bit is to be disciplined and put it into practise because we always think we know better. Congratulations Niall great quality.
This is a great article which I will be rereading like the pin bar, the fakey and tail bars.
Nial, Thank you.
This is a great article and I will be rereading it ,like the pin bar the fakey and tail bars.
thank you Nial.
that’s really cool information you share it nice Thanks Nial
Hello, Nial.
Great article Nial, I’m really enjoying being part of this trading site. With each of your article, I’m a successful professional trader.
Thank you very much.
Perhaps one of the most precious gifts I bought myself over time is LTTTM courses. Really loud and proud about Nial and the gang and what I’ve been taught. And really proud of my hard work before, in any level, observing a naked chart for two years, hence I discovered this “tip”. It’s the most powerful tool ever, works in any timeframe, stocks, forex, commodities, you name it. I using it only in W and sometimes D. Market is doing always the same thing. Anything else is just useless information. Most of my entries are blind, set and forget long in advance. Getting a goodnight sleep, through risk management and a very good R/R. I encourage everyone to put this “tip” under the pillow and sleep over it for as long as it takes. One day you just woke up and the chart is crystal clear to you as the blue sky. God bless.
excellent article and screenshots.. I find it more and more interesting to see how price behaves and how predictable trading can be when you know what to look for on a chart and when a trade is possible…
it takes the guess work out of it!
thanks Nail
gr8 article – keep reading it over and over again.
This is a nice article boss, I really love and understand it well. More grease to your elbow.
Thanks Nial yet again for another great lesson its so true.
Thanks Nial
thousand thanks guru…u teach me a lot about the forest of the market.i always keep in my mind what u has tought us..TLS, patient like a crocordile and come in to the market confidently just like a sniper…so glad to tell u now i can see the fruit of briliant work u had done…bravo..
This was rolling vaguely in my mind as I was reading different charts recently; now you’ve made it crystal clear. I believe it must be very powerful if you can use it with a proper understanding.
Thanks Nial .God bless you and your family
Thanx Nial. This article not only augments some of your earlier blogs/course materials I have come across that prevented me from jumping on the fast moving train or standing before its lightening momentum, but has also strengthened my ‘gut feel’ as most cases I feel tempted when I miss a set up or when my entry in not triggered by just fraction of pips, but I learn t to sit on my arms and wait for such a retrace that you have discussed in this article. Thanx to your whole team.
A big thank you Nial! you are a rare gem. Am sharing this stuff with my twitter followers. This is a real great stuff. keep it up Nial and remain blessed.
This blind entry idea, with limit order in the event area, looks very compelling and is similar to a Supply & Demand zones trading concept, and is suitable for traders with a full-time job (as you can enter a set & forget blind order, with a stop loss). It also offers high R ratio trades. The win rate is not very good, with this method we sometimes catch a falling knife. But hey, no system wins all the time ;-) Thanks for sharing. This, just like also false breaks trading, is a great add to pure price action trading.
i Agree with this article, very beautiful and awesome tips with examples. These examples and articles open the eyes of those traders who use lots of indicators and don’t pay attention to price action. I confidently say that and i guaranteed that price action do worth it, and they worked well. I have been following Nial’s strategy almost a year. Just like these examples. I almost trade often in Daily and 4 Hr chart. And with the guidance of you i now understood that waiting for the appropriate setup leads to profit trades. My experience in my trading mostly i saw good trade setups 11-12 trades per month. And Nial’s always say that “Quality is important in trading not quantity of trades”.
Right! Mostly watching D1 charts but surely as price gets close to keylevels it might pay off to watch H4 chart for signals because there might develop signals that are not visible on D1 charts or it’s too late at the end of the day. Recently (H4) EURUSD, USDCHF, GOLD very good examples of intraday entries. Not to promote intraday trading :)
Thank you Nial.
Its wonderful thanks a lots
Thank u Coah! This is one of the best articles you have ever written and the “blind entry” just completes the puzzle and closes the gap that has always constrained my price action trading strategy!
Wonderful article ! Thanks !
Thank you Nial for your great explanations like always.
Looking forward to seeing your future articles
Hi Nial, an excellent article! It reminds me why I need to “remember” and not “forget” these key market levels for future reference. Although I knew that one of the factors to consider when identifying key market levels was to consider what price did in the past on these levels, I guess wasn’t particularly looking at it the way you explain. Thanks a LOT.
One question though: when you talk about a “blind entry” what exactly do you mean? Do you just mean entering without a price action signal as confirmation? On a close of a bullish candle after a pullback in an uptrend, or on a close of a bearish candle after a rally in a downtrend?
Blind entry means ‘no confirmation’
Nial as always just awesome!
This piece is so highly appreciated! Thanks
UR FOREX STRATEGY IS THE BEST, IT MAKES TRADING TO BE MORE EASIER AND INTERESTING.
Excellent explaining, Nial.
Raw price action is the only way!
Thanks
Ronald
This is some POWERFUL stuff!!!!!!! n very very clear
thanks as always nial!
Nial…..this is one of your best posts…I have been contemplating this method for 4 months now and you have now written about it! I have observed that one often misses great moves from these key areas simply because one did not get a good entry signal…but one does not always need that…Great minds think alike!
Nial…: )
I’m telling you guys, this stuff is POWERFUL!…
Hi Nial, I’m 100% with you on this. I love key levels instead of trying to jump on a running train i.e. in the middle of a move even if it is in compliance with Nial’s rules. So who says trading is difficult. You just need to know where to look for S/D levels. It’s as easy as ping pong. And as Nial demonstrates, there are even entries for the blind…..lol…Good job Nial, every trader should listen to you. After a journey of a 1000 indicators I know what I’m talking about.
This is really interesting. Thanks Nial
Great….
ِAn Excellent way for trading I always remember what you say.
Thank you