How To Catch That Runaway Market Trend
 It’s no secret that some of the major stock market indices have been screaming higher recently. If you look at an S&P500 daily chart for example, it’s been on fire for well over a year now, especially since the second half of 2017. To the outsider who doesn’t actively trade, it may seem super easy to take advantage of these one-way markets, but not so fast.
For those of us who’ve been around the trading block a few times, we know the feeling of the deer in the headlights during these runaway moves; you keep waiting for a pullback to get on-board, but the market just keeps going higher or lower, without you. Or, you keep telling yourself “This trend has gone too far, it HAS to reverse soon, right?!” So, this obviously begs the question, how can we take advantage of these ‘runaway trends’?
The following points will get you up to speed on how to properly tackle and take advantage of the beauty and power of a runaway trending market…
What is a runaway trend?
Firstly, you must be clear on what a runaway trend actually looks like. Whilst there is no universally agreed upon definition of what constitutes a runaway trend, it’s fairly obvious as to when there is one and when there isn’t.
There is a concept that I call a ‘perfect trend’ wherein a market is respecting the reversion to the mean (think pullbacks to moving averages, see course for more) and nearby horizontal levels as it repels or bounces cleanly away from them on every attempt at a rotation (retracement). I discuss this concept a bit more in an article I wrote on how to identify the trend on charts. Now, let’s look at very good, dare I say ‘perfect’ example of a runaway or ‘perfect trend’ that has been underway for well over a year in the S&P500 index…
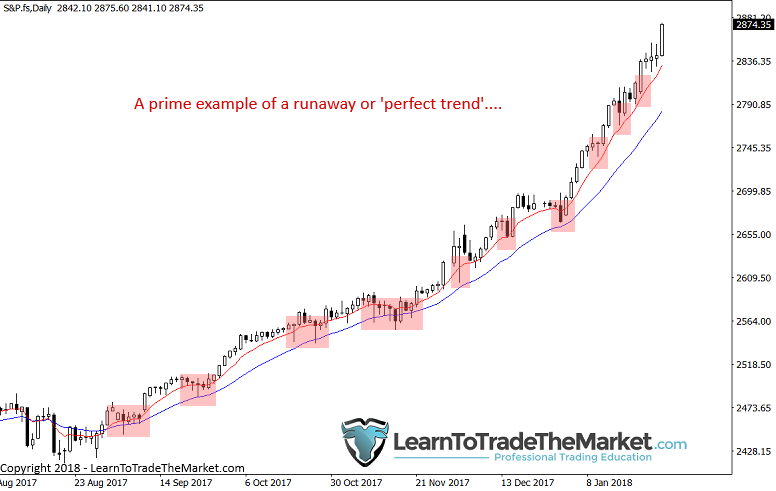
One concept to understand about these runaway trends is that one of the characteristics they exhibit is very small pullbacks or retraces back to value. For those of you new to this, a retrace back to value simply means price pulling back to a support (in uptrend) or resistance level (in downtrend), this can also be called reversion to the mean as mentioned previously. So, to put it succinctly, the stronger the trend, the shallower the pullbacks will be within it. The important consequence of this phenomenon, is that when a market isn’t pulling back much (because it’s in a very strong trend) and price is shooting to new highs or lows with no nearby obvious horizontal levels (especially as in the case of new all-time highs or lows, like the S&P500 right now) to slow its movement, the market can EASILY continue surging higher or lower.
So, it’s sort of a positive feedback loop if you will; price is moving aggressively in one direction with little to no pullbacks because the underlying fundamentals of the market are very strong and because there are no technical levels to impede it. More and more people pile on and price just keeps sailing in the same direction, offering you very little in the way of trading the pullbacks, but if you know how to take advantage of this, it can be very (dare I say) easy money.
One important aspect of runaway trends that is sometimes overlooked is that closing prices are the most relevant price factor in the technical analysis of a market. Now, what exactly do I mean by that? Well, in a strong trend, we need to pay more attention to the closing prices than any other price, because that closing price is likely to be a clue as to what will happen next (reading the price action). Closing prices mean more than just where market has been, the close is the information that lets us know if something is confirmed or failed.
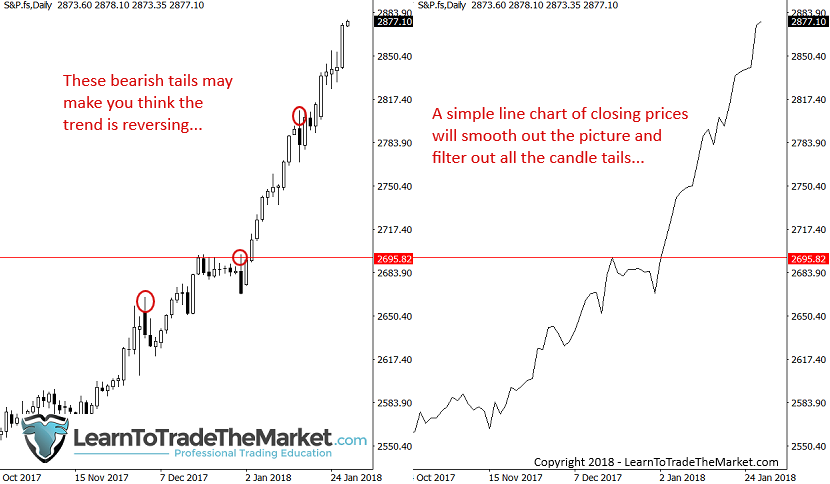
When trying to determine trends and looking for signs of runaway / strong trends that are starting up, the weekly chart takes precedence…but be careful, candlestick charts can ‘hide’ this information or make it harder to see at first. For this reason, I always scan through a line chart on the daily and weekly in an attempt to identify a market that is beginning to trend or is already trending. It is much easier to see if a strong trend is underway in a line chart (applied to close) because it filter out all the wicks / tails of the candles and just shows you the direction and key levels and what happened at the levels. If you don’t believe me, pull up a daily candle chart and then switch it to a daily line chart, you will see new information you probably didn’t see originally.
Watch the main key weekly levels in an established trend. This can protect against shake-outs and provide a much clearer picture for filtering all the wicks of candles. To do this, you can switch over to a line chart as it will filter out the wicks / tails of price bars to give us a smoother view of the overall picture.

Another example of a candle / bar chart vs. a line chart. It’s wise to check the line chart to see a clear picture of the trend…
How to trade runaway trends
Okay, so now that we know what a runaway trend is and a basic way to identify them, let’s discuss how you can take advantage of their power, so that you are no longer that ‘deer in the headlights’.
Perhaps the biggest thing to understand is that there won’t be major pullbacks to levels in a very strong trend. So, rather than just waiting around for a pullback that never comes, let’s see how we can get on-board a strongly trending market.
The primary thing you are going to focus on is intraday pullbacks, I am talking here about the 4 hour and 1-hour chart time frame with price action signals to confirm entries. You are going to want to apply the 8 and 21 daily chart exponential moving averages (emas) because price will often pull back to this dynamic value or support / resistance area before moving on with the trend again. We can also mark short-term or nearby horizontal support and resistance levels to look to trade from them. Another good option is breakouts, specifically inside bar breakouts in a runaway trend, these are fairly common and let you take advantage of a trend that isn’t pulling back. Let’s look at some examples….
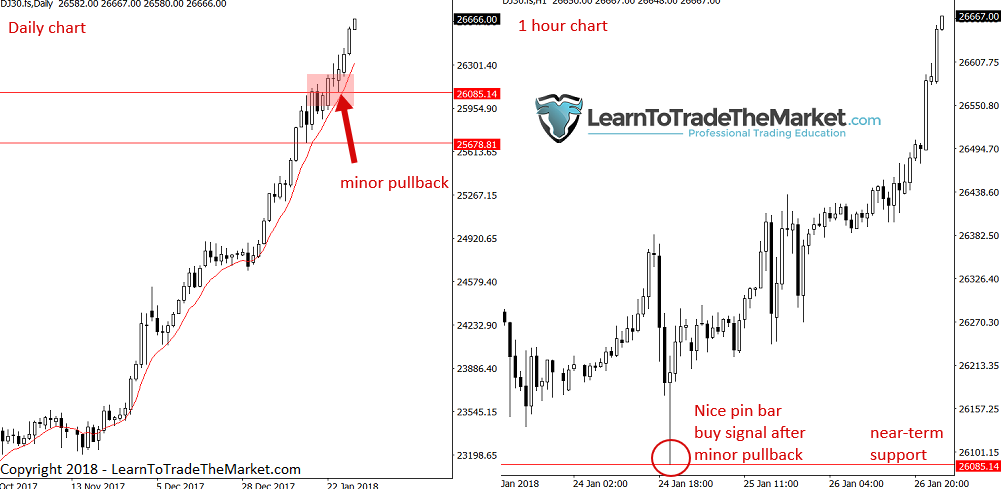
In the chart below, we see a nice example of a recent and current runaway trend underway in the Dow Jones Index. Pay close attention to the small pullbacks that happened to the 8 and 21-day emas (red and blue lines) as these are going to be your most common pullback opportunities in such a strong trend. Note the horizontal level as it will be important on the subsequent chart…
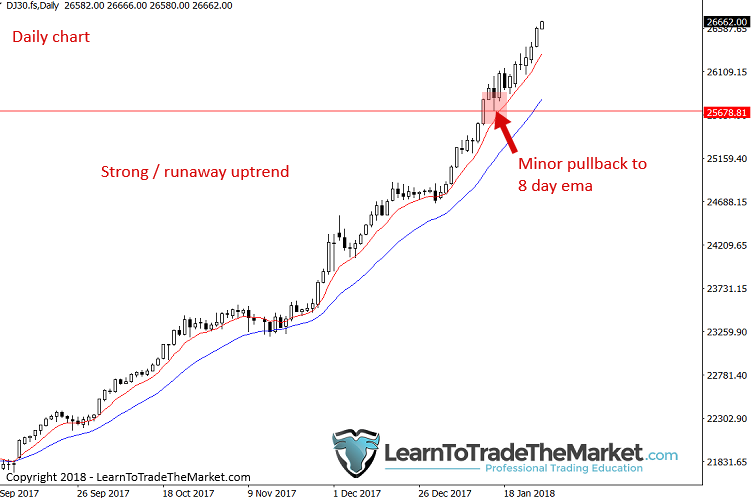
Next, look at the 4-hour chart of the same market from above. The pullback we discussed above to the 8-day ema resulted in a 4-hour pin bar buy signal as we see below. This is how you can successfully catch a runaway trend! You have the trend, then all you need is a level or a signal, as in my T.L.S trading approach, here we had a strong trend and a strong signal, boom.
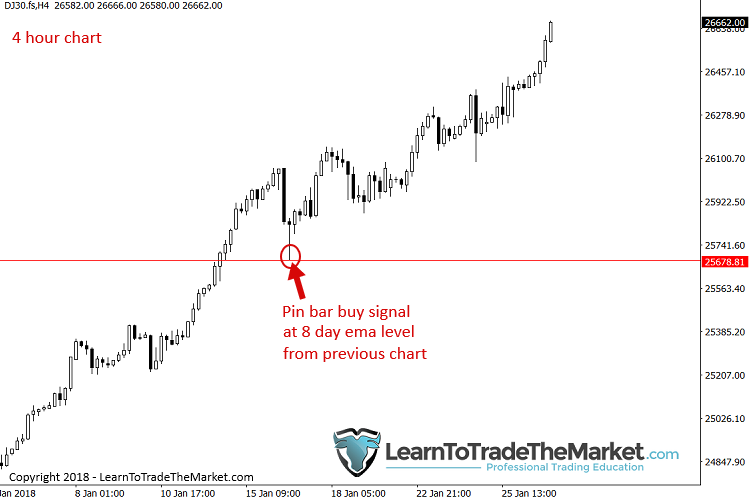
In the next chart, we are looking at a side by side recent example (January 24th, 2018) of how to use the 1-hour chart to look for high-probability entries into a runaway trend. This is the same chart as above, the DOW30, we can see a minor pullback last week to the 8-day ema on the left, which resulted in the very nice pin bar signal on the 1-hour chart on the right. When you see a signal like this form, it really should be a no-brainer to enter it, set stop below pin low and print some money…The key is waiting for a signal like this to form and not jumping in on low-quality / non-obvious signals or on anything under a 1-hour time frame…
Important note: Now, it’s important to understand that we are not “intraday trading” by doing the above, instead, we are using 4 hour or 1 hour or daily charts to confirm entries on trades that may last for days or weeks. Just because you enter a trade on an intraday chart doesn’t make you a day trader! Using an intraday chart to find an entry into a strong daily or weekly chart trend is simply a way to refine and find an entry into a runaway trend, but we are not jumping in and out of the market constantly as a day trader would.
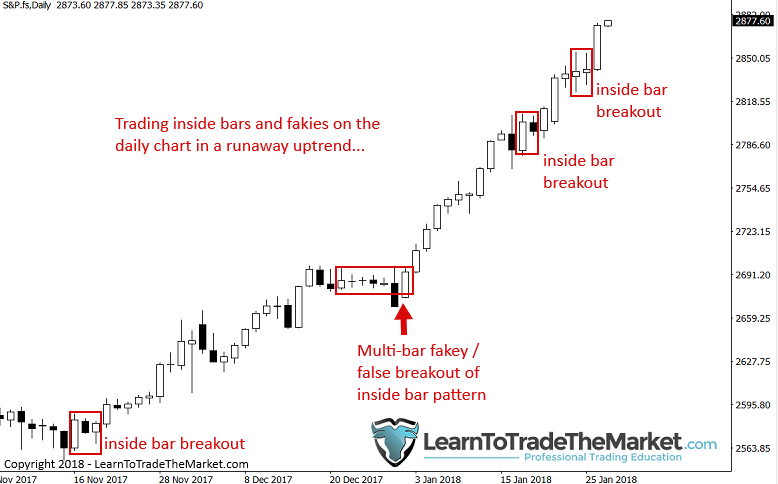
To take advantage of breakouts in a runaway trend, my favorite plays are inside bar patterns and my proprietary fakey trading signal. Inside bars are common on the daily chart in a very strong / runaway trend because the market will make a brief pause after its most recent move before shooting higher (uptrend) or lower again (downtrend). Below, you can see some examples of recent inside bar breakouts and a multi-bar fakey pattern that led to a trend continuation and provided savvy price action traders a low-risk and very high reward potential trade entry…
The psychology of runaway trends.
The biggest thing to remember regarding your mentality when dealing with very strongly trending markets is to not over think. Markets go further than we often think they will, so remember to trade with trend until it clearly ends!
One of the main drivers of large sustained trends is the fact that the market continues to weed-out the people betting against it (there are more than you’d think), remember that when a trader goes short and bets against a bull market, if the market goes up they must cover that position by buying, this in turn leads to further bullishness and a swarm of fresh orders. These runaway trends can fuel themselves in this way for a very long time, so don’t bet against them!
Just like a freight train is incredibly difficult to stop and takes a long time to slow down let alone reverse direction, a strongly trending market is a force to be reckoned with. Its momentum and power also make it the best market condition to trade in and provide the closest thing for ‘easy money’ that you will find in the trading realm. Unfortunately, these runaway trends don’t come around very often, so when we spot a market in a runaway trend we need to know what to do and we need to act decisively, and the strategies discussed here today are a good starting point for you.
Conclusion
Finally, even if we know the bias of the charts and that bias is extremely obvious (like right now on the stock market), we often still won’t have enough confidence to pull the trigger on a trade. Traders often freeze in a state of disbelief, saying to themselves “This market can’t go any further, it just has to reverse!”. If you do this, you are going to lose. Don’t make up scenarios that you think “have to happen in the market”, instead, focus on what is actually happening and just use that to your advantage until it doesn’t work anymore.
I have found in my 14 + years trading that runaway trends like those shown above are one of the best opportunities to make money, because as I have already pointed out, the strong sustained moves (up or down) often keep going so far beyond what seems rational or logical, due to greed, euphoria and people being forced to cover bad bets they have made against the market (as well as underlying fundamentals supporting the trend). With the combination of technical analysis knowledge and psychological knowledge we touched upon here today, as traders, we have an edge and should exploit it when it’s present. These things are perfected through years of screen time and watching these market conditions unfold, it’s not something I can teach you overnight, but you can certainly apply the concepts I teach in my courses and on this site in general to help you spot runaway trends and profit massively from them.
What did you think of this lesson? Please share it with us in the comments below!


I am a firm believer of everything you say in your articles, and I have back tested the strategies provided here–it worked like charm. Thanks a lot. You are indeed a professional. God bless you for providing such invaluable articles for our benefit.
Another lesson on place a trade in the longer time frame and dispelling the myth on day trading and giving traders a great perspective on trading using set and forget by place a trade and watching run into profits for days, weeks and probably a month
very incisive and elaborate. thanks a lot
Mr. Nial! super!
Very good advice although I would have liked you to have suggested the dollar amount of risk and how to set the run away trade limit. I’m a newbie and do not know better
Regards
Nial
Excellent article.
I set up my chart with 8/21 emas.
In addition I also use the 26 lagging Chikou Ichimoku line which records the close of the bar. All other Ichimoku indicators are removed.
This set up is invaluable as it instantly indicates S/R areas for any given period.
it very nice idea – Good Luck from Poland
Great article, especially how to read different timeframes, another step in my learning curve. Thanks !
Muito obrigado por disponibilizar esses materiais que são muito rico em informações! Seus ensinamentos me ajudaram em muito a melhorar a maneira como opero… lhe acompanho a anos! Forte abraço
like a horoscope always if i need to , you post an article like i would ask you for . hope to meet you one day , best regards
Very Nice article.thanks Nial
Just to say thank you Nial. Everything you write makes perfect sense and is easy to understand
Thank you very much Nial and team!
Very very helpful at the moment with the indicies Great clear methodology Nial I love it
Thanks Nial
Great article and examples that will come in handy.Thank you Nial. You are The best.
Thanks Nial! Your articles always great and an eye opener. Thanks again.
Really helped Nial
Trades still open with S&P, Dow and Nasdaq and have already locked in profit
But, how far do I go? Getting a bit nervous now on the exit but your article has made me much more comfortable today
Let the profits run!!
Thanks
Very great article indeed, I was just wondering how to trade these runaway trends that were happening the past 2 weeks. Thanks Nail, I will be ready for them next time!!!
well said ,this is very instructive and valuable lesson.you are always on point, thanks Nial
Invaluable advise again, it is as always a confidence thing in believing that the train will keep racing forward until a driver puts on the brakes, and dont forget there will always be another train/ bus later to catch and ride to happiness/ success.
Thanks nial (•-•)
Excellent article as always Nial.
You are indeed a professional trader, mentor and the messiah for the children of God.
Wish all the best
very simple and practical thank you so much Nial…God bless you.
Great article . Very valuable information.
Its a great article and perhaps much easier to understand now that we have these insane uptrends in the Dow & S&P etc! The simple concepts of Trends & Pullbacks are something that every new trader should quickly get to grips with! I just wish i would have realised this several yrs ago! I would have saved myself a lot of Pain! Its much easier to see and understand now that we have these runaway markets and i i dont actually recall you doing a Lesson quite like this one Niall which shows things so simply? Its scary to think that these markets have been uptrending for several yrs now! I only started trading in 2012. Just think of the money that has been made by more experienced traders using pullbacks to add onto their already existing positions!
Valuable insights and clarity thank you Nial
Thank you Nial , always appreciated with your articles.
Nial, I am always reading your articles and find there is lot of wisdom.
Please keep it that way, simple but very powerful .
God bless you!
Pin bars on a 4 hour chart are highly accurate. Even on a 15 min chart IF used at a STRONG Support level not in the middle of some trade. Nice articles Nials.
Thank you – Maestro Nial
Thank you Nial for the excellence article and tips which inspiring traders how to ride a runway market move. Nothing compares.
Excellent Nial, another invaluable article thanks
Thank you Nial. :)
Thanks Nail I will add this to my trading plan, greatly appreciated. Namaste
thanks for opening our eyes on the magic underlying run away trends
Thanks Nail this is a great article.