6 Tips On How To Identify The Trend On Charts
 Through my 15+ years experience in trading, I have discovered that when it comes to identifying the trend of a market, there is no magical tool, no indicator and no set of rules that always work. As traders, despite our best efforts to analyze the charts and carefully determine a bias on the charts and trade in-line with the trend of the market, ultimately the direction of the market can quickly change at any time. If things don’t go to plan, we should use the benefit of hindsight analysis to dissect the chart and figure out what we initially missed and what went wrong. Just remember that this isn’t an exact science, and sometimes, despite our best efforts to make sense of the charts, the market will just move in the opposite direction. Don’t beat yourself up.
To be clear, trend analysis is only one part of the overall trading strategy I employ to enter and exit trades. It is never a good idea to enter a trade based on one factor alone, which is why I look for as much evidence as possible to confirm a trade. In my own trading plan, I employ a concept known as T L S confluence, an analysis technique which brings together; trend analysis, level analysis, and signal analysis.
When reading today’s lesson, keep in mind, I am not talking about “trading the trend” here, I am simply providing a set of filters and observations to identify the most obvious direction the market is likely to head. Also, the market may look like it’s trending in one direction, when in fact it’s actually trending in the other direction. This is because many markets experience short-term retracements, which tend to deceive traders. For this reason, always zoom out and look at the bigger picture on the charts and then zoom in and drill down from there.
We will start with the simpler techniques and work our way to the more advanced techniques.
1. Visual observation is key.
The first thing to understand about trend identification is that it is not a perfect science. I try to keep it as simple as possible and I start off by just visually observing a bare price action chart, with no indicators.
If you ask different traders, you will hear different versions of what the current trend of a market is. Some will give you the short-term trend, some the long-term and some the mid-term. However, the most important trend to identify is the most obvious current dominant daily chart trend. We can identify that using both short-term and long-term analysis, which begins by simply observing the charts.
I like to ask myself, what is the chart looking like over the last year or two, 6 months and 3 months? That shows me the long-term, mid-term and short-term views, respectively. Doing this gives me a very clear idea of the overall chart direction moving from left to right. If all else fails, zoom out on a daily or weekly chart and take a step back and just ask yourself, “Is this chart falling or rising?”. Don’t over complicate it!
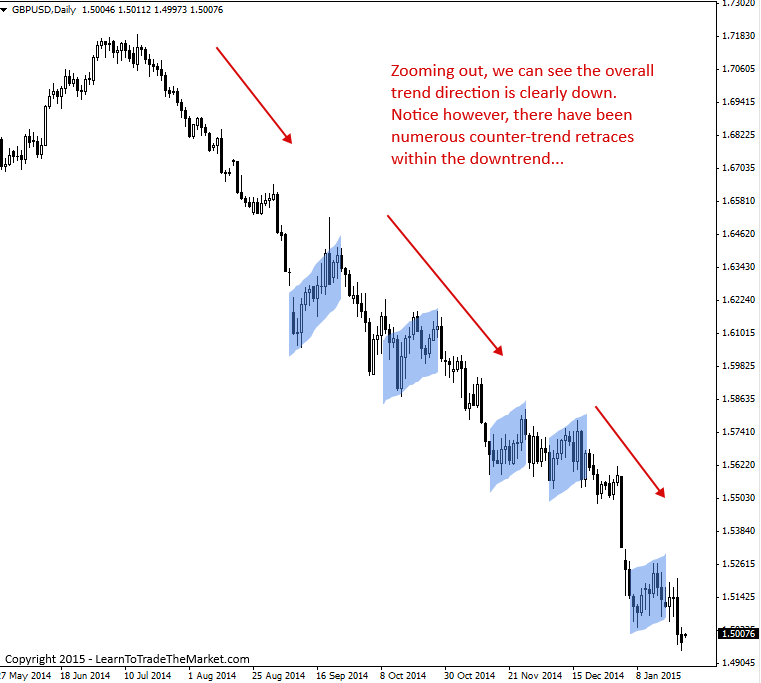
By taking a look at the general direction of the price action in a market over the last 3 month to 1 year, we can easily see whether it’s generally trending up, down or even sideways.
2. Identify the most obvious swing highs and lows.
As markets trend, they leave behind swing points on a chart. By paying attention to these swing points we can quickly see which way a market is trending.
In the chart below, notice we have a clear uptrend in place in the S&P500, something we have been discussing for months now in our recent S&P500 market commentaries. Notice the highlighted areas, these are swing lows within the uptrend and if you just focus on those highlighted areas you will see they form ‘steps’, stepping higher as the market moves in the direction of the trend…
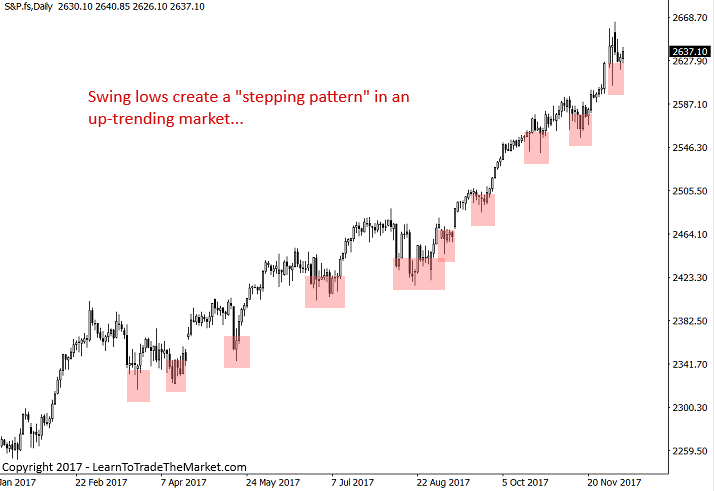
Note, in a down-trending market you’d be more focused on swing highs and seeing if they are creating a stepping pattern to the downside.
3. Higher Highs, Higher Lows, Lower Highs and Lower Lows
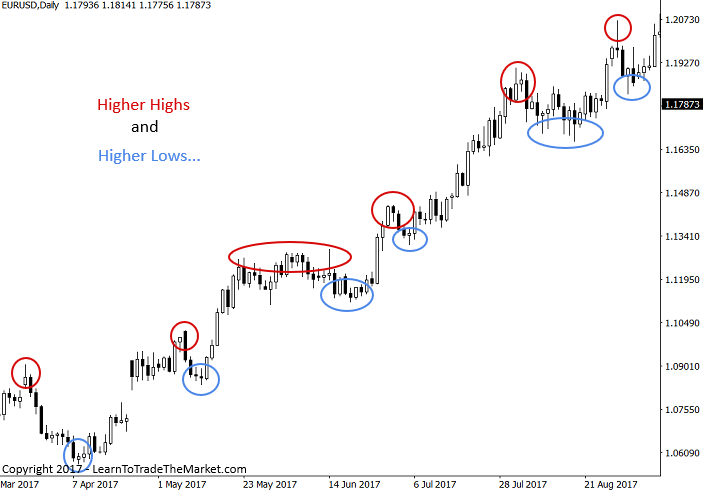
Once you have drawn in the obvious swing points on the chart, you can then determine if the market is making HH and HL or LH and LL: HHHL – Higher Highs and Higher Lows, LHLL – Lower Highs and Lower Lows.
Generally, in an uptrend you will see a fairly obvious pattern of HH and HL from the market’s swing points, and in a downtrend you will see a fairly obvious pattern of LH and LL from the market’s swing points. We can see an uptrend was in place in the chart below, as you can see from the clear pattern of higher highs and higher lows…
4. Is the market appearing to ‘bounce from value’?
Check the behavior of the price action after retraces and check it as it approaches the long-term moving averages such as 21 day ema (exponential moving average) or a key horizontal resistance level. Does the price action repel down as in a downtrend or bounce up as in uptrend? This kind of price behavior is a good clue to confirm the underlying bias / trend of the market.
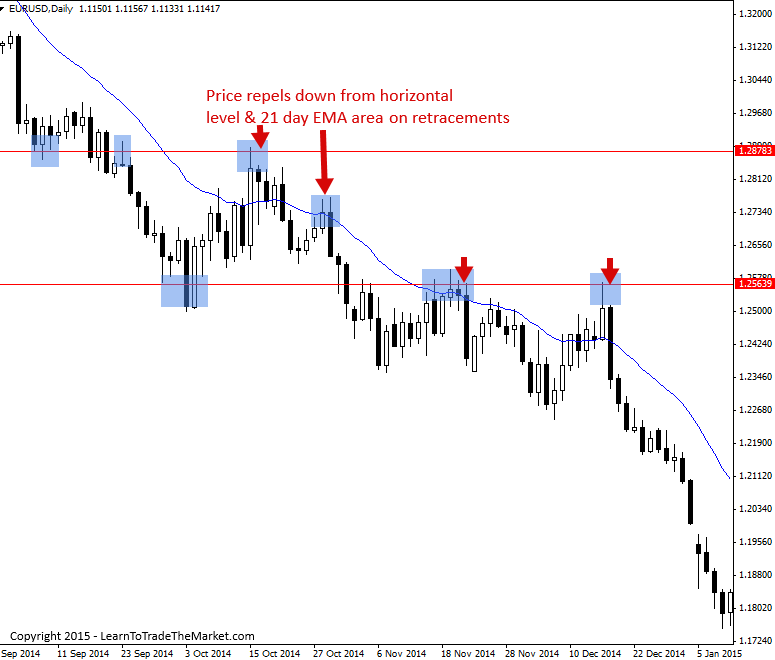
In the chart above, we can see that all retraces higher to both horizontal resistance levels and the 21 day EMA were met with selling pressure as the dominant downtrend remained intact.
Put a 200 and 50 day ema on your chart and check out the long-term slope of these ema’s. This is a good quick way to identify the overall dominant trend of a market. You should look at how prices are reacting near the moving averages (value zone), if the price is respecting those EMA levels and repelling/bouncing away from them on several occasions, you have good evidence the market is trending (a concept I call a ‘perfect trend’ and expand on in more more detail in my price action trading courses). The chart below is a great example for theory purposes, just don’t expect to see this every day.
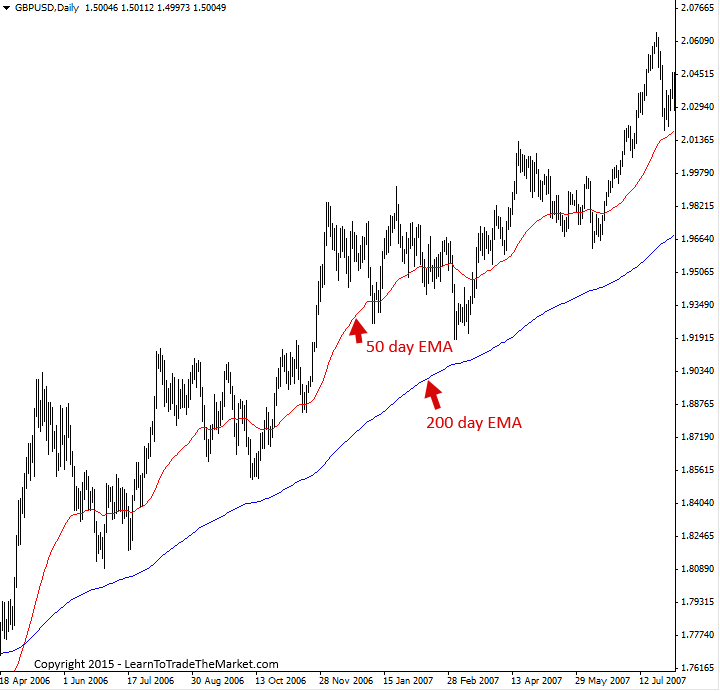
Notice in the chart above, the 50 and 200 period EMA’s give us a good quick-view of the dominant daily chart trend direction.
5. Are there price action signals forming?
If you see price action signals that are producing substantial movement in-line with the trend, this is another confirming factor for your directional bias on a market. Also, remember that repetitive failed price action signals suggest the market is going the other way (and possibly changing trend).
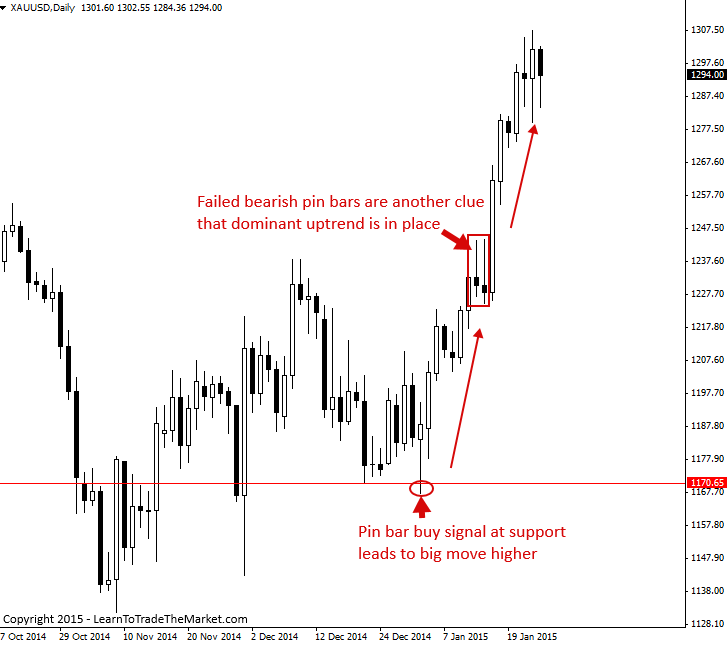
In the chart above, notice how the bullish pin bar at support really kicked off the uptrend which was again ‘confirmed’ by the failure of the bearish pin bars.
6. Change in trend direction
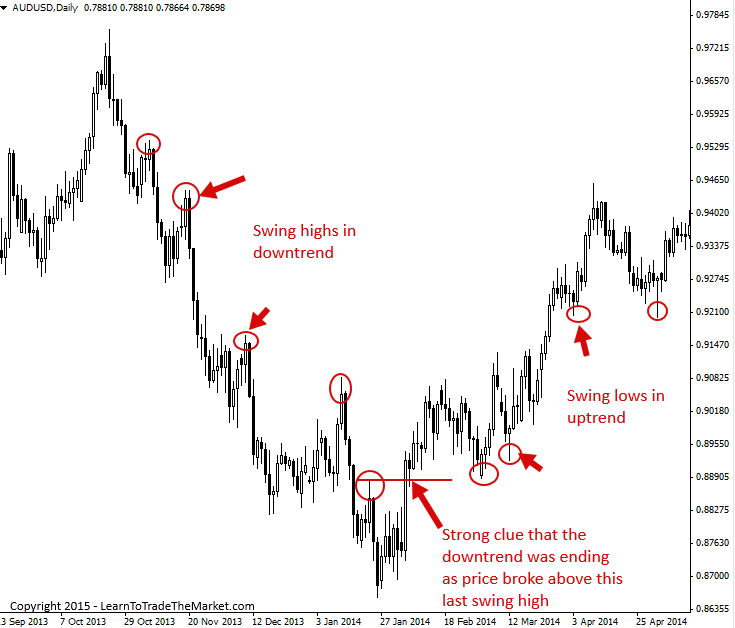
If a market is trending lower, we want to pay close attention to the recent swing highs, and in an uptrend we will focus on the recent swing lows. We do this because it not only shows us the overall trend, but it also shows us via the price action if the trend is still intact or not.
For instance, if you have a series of Higher Highs and Higher Lows as in an uptrend, when you see price break down past the previous swing low, it’s a strong indication that the uptrend might be ending. Conversely, in a downtrend we see Lower Highs and Lower Lows, and when price breaks above the previous lower high, it’s a strong indication that the downtrend might be ending.
Conclusion
Once you are confident you have identified the trend / directional bias of a market, you then look for a signal or area / level of the chart to enter. We call that confluence and it’s a concept that would require another lesson to explain, check out a lesson on trading with confluence here.
Finding the market bias or trend is tricky, especially for beginning traders, and most traders will find this to be a sticking point in their trading development. It’s OK to understand various entry triggers and setups, but if you’re trading against the dominant market bias, your probabilities of making money decrease dramatically. There is always a bias, and as beginner traders especially, you would be well served to stick with it.
In my professional trading courses, I expand in greater detail on how we identify and trade various forms of trends using price action signals as confirmation.
I WOULD LOVE TO HEAR YOUR THOUGHTS, PLEASE LEAVE A COMMENT BELOW :)
Any questions or feedback? Contact me here.


Thanks so much …have really learned
thanks for tutorial the best on youtube i hope you get back posting videos
on youtube thank you so much
“温故而知新可以为师矣” – “Review the old and know the new”
I have finished Nial’s course and traded in practice, and I will continue to read Nial’s valuable experience again and again.
I thank you so much for such a wonderful idea on how to identify the directions in the trending market.
Good set up. Death cross on the side and 55 end of corrective move and powerful light at the zone.perfect set up for the metal.
If your article alone could give so much insight, I’m wondering how your course would be!
I’m coming to register!
Thanks Nial,
You’re wisdom is priceless.
I am always learning something from your articles each and every-time I read one.
You’re a champion.
Thank you.
Well the most toughest part to identify the change of trend .. Whenever I think Market is changing its trend I came to realise later on that is just another counter trend and counter trend follows the swing high and low rules . I want to know when this counter trend becomes the real trend I mean after how many pullbacks against the trend can tell that that trend is changing 2 pullbacks 3 pullbacks or 4 pullbacks .
Thanks a lot for the insight on identifying the trend because trading without the knowledge on the direction of a trend will lead to wishing thinking on open trades because the market will always be against your positions.
Oh wow, I love this clear lecture because it added to my understanding regarding trend identification. Personally, I use 150 and 50 for to determine long-term trend and 21 in addition, and this has really been of great help for me in my trading career. Every successful price action trader must first know how to identify trend clearly before placing a trade.
Thanks Nial for this.
It’s a great sharing for all traders ;)
You are great . I really feel improvement in my trading after deep analyses of your course.
Thanks Nial once again for the insight .
Please I want more clearity on how to mark my levels on the chart ie Horizontal levels on daily time frame.
I am still a little bit confused on this , Is it from the current swing high or swing low, or from the level where price retraced?
Your kind explanations will be highly appreciated.
Regards,
Euphemia Nwachukwu.
Thanks Nial, I so much appreciate this post. It has given me more clearer picture on how to identify
trend and finding levels of support and resistance.
May God bless and increase your knowledge in Jesus Name Amen.
YOU ARE A GREAT TEACHER INDEED.
I truly needed this help.
Nial .
i have been to so many different schools in trading forex ,but not like what i am learing from just from the articles only ,thanks my friends
very interesting explanation…
thanku
Nail Fuller:
This is the most detailed and informative explanation of Price Action and how to identify the trend, prove reaction to major Support and Resistance lines as well as the correlation with 50 and 200 EMA’s respectively.
Thank you,
thanks Nial this information is too insighful
Thanks Nial, I start following your Lessons
Thank you very much for an excellent lesson
good lesson sir but i need more help
Thank you Nial can’t believe you giving us so much information for free you are a blessing!
Interesting read Nial, although it is easier said than practiced. Yet we cannot take away the established truth expounded there in, and the possibility of excelling if we give in to learning and understanding. I am always wowed by the simple yet in dept content in your lectures (that is what i prefer to call your write ups). Kudos to you boss.
Very useful article, good explanation about basic things. Thanks for sharing
I think you are the best of all
Thanks to you Nial.
Nial, thanks. You are good.
Thanks very much .. a good lesson
your materials are indeed helpful. thanks
lovably indeed. God bless you for giving away such precious articles like these for free. too good to know. thanks Nail.
Thank you Niall, makes great sense .. and quite easy to implement. Great teaching
Nial your the best….thanks .
Thank you, Nial and team.
i am really learning a lot, tough still on demo all your applications are working for mt=y trade entries
Always valuable, helps me keep on track
I can already imagine myself like a forex traider. Such a cool post.
This is a very good article…..
this the holy grail
Great lesson Nial
It’s always good to go back to basics and there is always something new you can learn in this business.
being able to share your knowledge is a Nial honor.
Top lesson, Nial! A great reminder to check on the old TLS! Many thanks as always!
I Started making consistent monthly profit after I met Nail Fuller, He is such a great guy.
Enjoy all your articles Nial… great value and info.. luv it !!
Great clarity Nial. I know you trade daily time frames but do you think the same principles apply as accurately to one hour charts? (I do pretty well on one hour charts but I COULD DO BETTER.)
.thanks Nial..great lesson Sir…
.thanks Nail..heart lesson…
Thank you Sir for the insight
Thanks Nial indeed a good lesson
Thanks Nial indeed a good lesson
Great lesson Nial! Thank you!