The 7 Types of Support and Resistance You Need to Know
 Markets ebb and flow; they go up, they come down and they move sideways. The primary ways we make sense of these movements are analyzing the price action as well as the levels in the market where price bounced higher or rotated lower, we call these levels support and resistance.
Support and resistance levels form the foundation of technical analysis and they help us build a framework from which we can understand the market. For price action traders, support and resistance levels help us plan our stop loss placements and profit targets, but perhaps more importantly, these levels give us a way to make sense of the market in terms of what it has done, what it is doing and what it might do next.
As I teach in many of my lessons, my overall trading approach can be summed up by the acronym T.L.S or Trend – Level – Signal. This lesson is primarily about the L (levels), I discuss the Trend and Signal portion of T.L.S. in other lessons, here are a couple:
A Complete Guide to Trend Trading
In this lesson, we will not just be showing you how to draw support and resistance levels, but we will delve deeper and discuss how to use these levels to find high-probability trades in range-bound markets, determine trends, define risk & targets and more. I hope you enjoy this lesson and refer back to it often, as it is jam-packed with helpful explanations and examples…
The 7 Most Important Types of Support and Resistance & How to Use Them…
- Traditional swing highs and lows
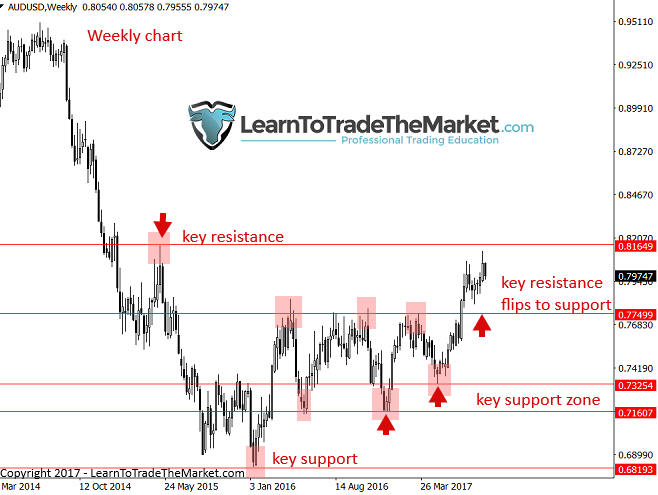
Perhaps the most important support and resistance levels are traditional swing highs and lows. These are levels that we find by zooming out to a longer time frame, typically the weekly chart or possibly even monthly. This is where we get a ‘bird’s eye view’ of the market and the major turning points within it. What we want to do is simply identify the obvious levels that price either reversed higher or lower at and draw horizontal lines at them. These levels do not have to be ‘exact’, they may intersect price bars or they may be zones rather than exact levels. You can consider this the first step in regards to support and resistance levels and it’s the first thing you should do when analyzing any chart.
Notice the ‘bird’s eye view’ we get by zooming out to the weekly time frame. Here we can identify major support and resistance levels, trends and trading ranges…
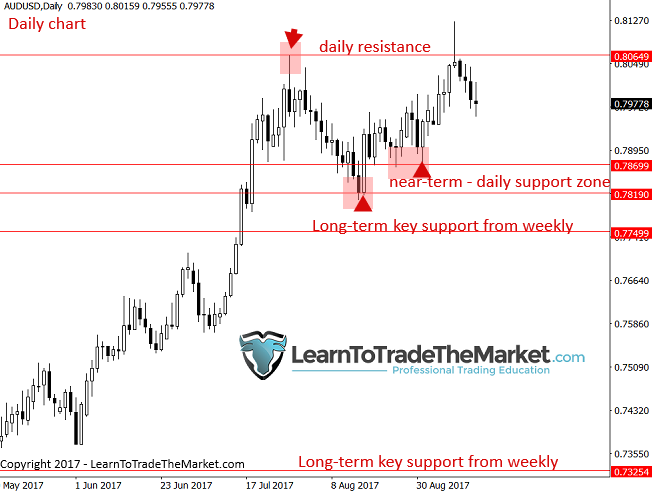
 Next, we want to zoom down a time frame, to the daily chart, to ‘fine tune’ our levels some more. The daily chart is the primary time frame for finding trade setups, so it’s important we understand the broader picture on the weekly chart but also that we have identified the shorter-term levels on the daily. I have a good video on this topic of mapping the market from higher time frames to lower, be sure to check it out. One key point to remember is that when you zoom into the daily or even the 4 hour or 1 hour, you always leave the higher time frame levels on your chart as they are very important.
Notice, by zooming into the daily chart from the weekly example above, some of the same weekly levels are still in play as well as some new shorter-term daily chart levels we couldn’t really see on the weekly…
- Stepping swing point levels in trends
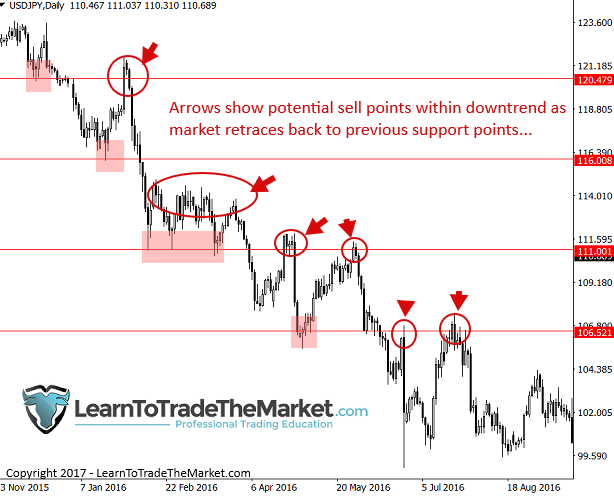
Have you heard the saying “Old support becomes new resistance and old resistance becomes new support”? This is referring to the phenomenon of a market making higher highs and higher lows or lower highs and lower lows, in an up or downtrend. We should mark these ‘stepping’ levels as they form, then when the market breaks down or up through them we can look to trade on retracements back to those levels, also known as trading pull backs. This also gives us a way to map the trend of a market – when you see this stepping phenomenon you know you have a solid trend in place.
These levels are good entry points as well as points to define risk or stop loss points. You can place your stop loss on other side of these levels.
For example, in the chart image below, we see a clear downtrend in place. As price broke down past the previous support level, that level ‘flipped’ to resistance levels that act as high-probability entry levels if price retraces back up to them.
- Swing point levels as containment and risk management
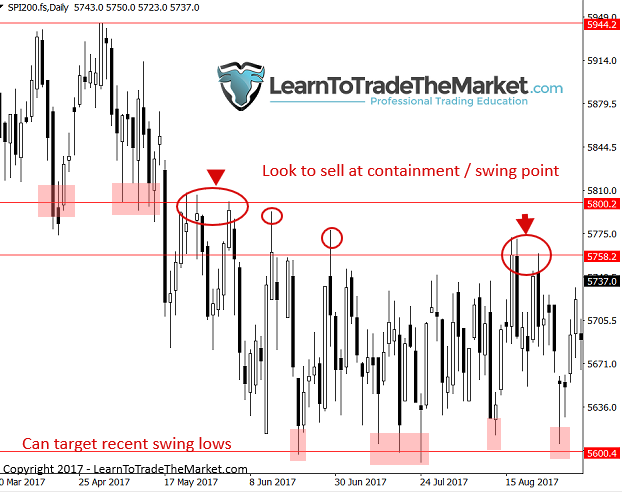
We can look to sell or buy at swing points even if they are not part of a trend. Markets spend much of their time consolidating and in trading ranges, so we should be able to find trades within those market conditions, not only in trends.
We can simply use the most recent swing high or low as a risk point to define our next trade, which you can see in the chart example below.
In the image below, notice that price broke lower, down through support, then it stayed contained under that level, which was then acting as resistance. We could look to sell at that level or just below if price stayed contained below it. In this way, that level is defining where we will look to take our next trade and we know if price moves beyond that level our trade idea is invalid, so placing our stop loss just beyond that level is obvious. We can also use recent swing points as profit targets. In the example below, notice how we could use the recent swing lows as profit targets.
- Dynamic support and resistance levels
Next, let’s talking about dynamic support and resistance levels. What I mean by dynamic is moving levels, in other words, moving averages. A moving average moves up or down according to what price is doing, and you can set it to consider a certain number of bars or time periods.
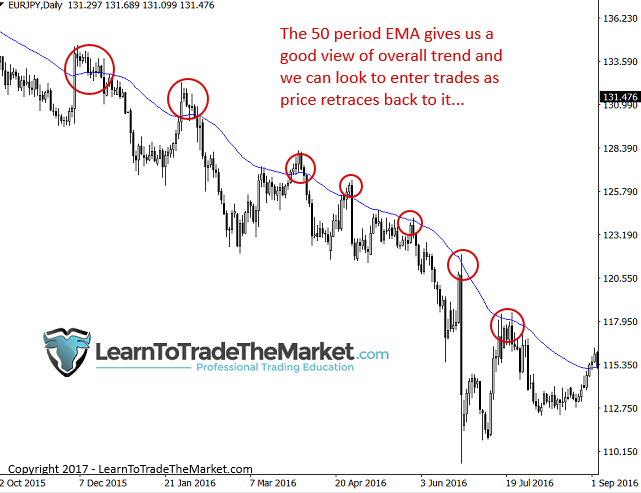
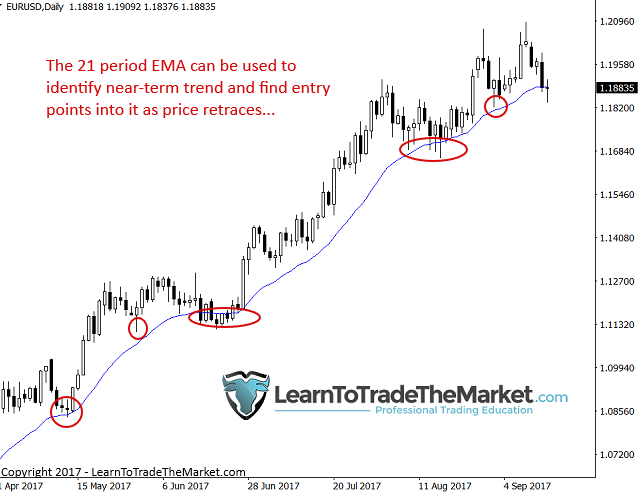
My personal favorites are the 21 and 50 period EMA or exponential moving averages. I like to use them on the daily chart time frame mostly, but they can also be useful on the weekly charts. These ema’s are good for quickly identifying the trend of the market and for joining that trend. We can watch for price to test the moving average after breaking above or below it, and then look to enter at or near that moving average. Ideally, the market will have proven itself by testing the level and bouncing previously, then you can look to enter on that second retrace.
Here is an example of the 50 period EMA being used to identify a downtrend as well as find entry points within it. Ideally, we will look for a 1 hour, 4 hour or daily chart price action sell signal as price nears or hits that level on a retrace back up to it in a downtrend like this…
The 21 period EMA can be used in a similar manner as we see below. Keep in mind, the shorter the EMA period the more frequently price will interact with the EMA. So, in a less volatile market you may wish to use a shorter period ema like the 21 rather than a longer one like the 50.
- 50% Retracement levels
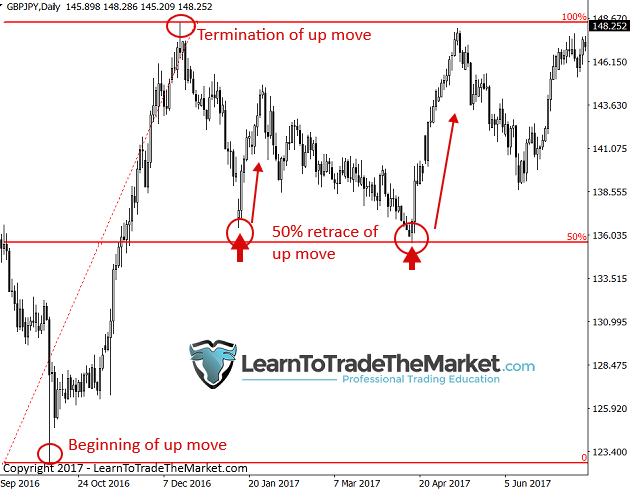
Whilst I don’t use traditional Fibonacci retracements and all their many extension levels, there is a proven phenomenon that over time, markets often hold the halfway point of a swing (circa 50 to 55% area), where market makes giant moves, retraces, then bounces in original direction. This is partly a self-fulfilling event and partly just a result of normal market dynamics. To learn more, checkout this lesson on How I Trade 50% Retracements.
Look at this example chart showing a large up move that retraced approximately to the 50% level on two different occasions, providing a very high-probability entry scenario, especially on the second bounce…
- Trading range support and resistance levels
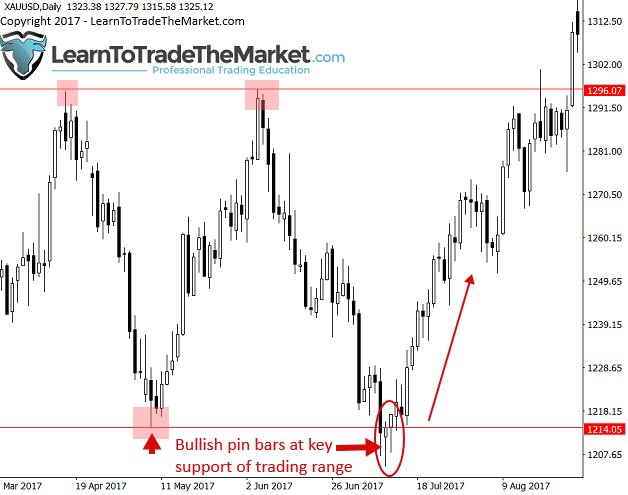
Trading range support and resistance levels can provide many high-probability entry opportunities for the savvy price action trader. The main idea is to first identify a trading range, which is basically just price bouncing between two parallel levels in the market, and then look for price action signals at those levels or look to fade the level on a blind entry. By fade the level, I mean if the market is moving up and at the key resistance of the range, look trade the opposite way, i.e. sell. Or, you look to buy the support of the range. You can literally do this until price clearly breaks and closes outside of the range. This is a MUCH better approach than the one most traders take in trading ranges – trying to predict the breakout before it happens and constantly getting whipsawed as price reverses back into the range.
Note, in the example image below, we had a large trading range as price was clearly oscillating between resistance and support. We could have entered on the second test of resistance (short) or on the second test of support (long) either blindly or on a price action signal like the pin bar signals we see at the support below.
- Event area support and resistance
The final type of support or resistance we are going to discuss today is event areas. Event areas are a proprietary form of support and resistance that I expand on in detail in my price action trading course, but, for now, let’s make sure you have a good basic understanding of them.
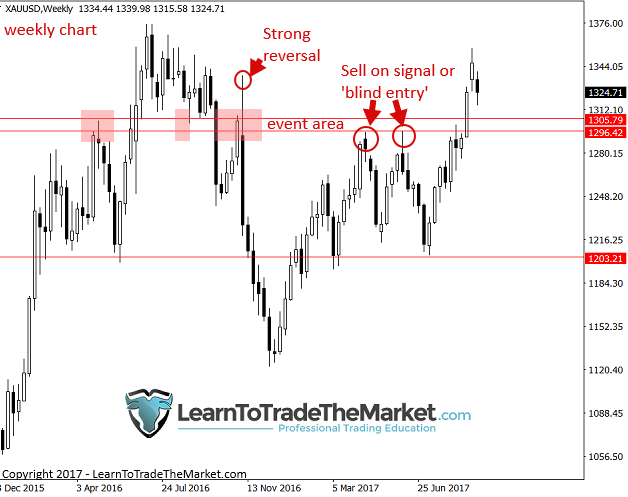
Event areas are key levels in the market where a major price action event occurred. This can be a big reversal or clear price action signal either of which led to a strong directional move.
In the example chart below, you can see a clear event level that was formed after a strong bearish reversal bar on the weekly chart (there was also a large daily chart bearish pin bar there). As price approached that level on a retrace some months later, we would have wanted to be sure to have that level on our charts as it was a strong level to look to sell at either on a blind entry or on a 1 hour, 4 hour or daily chart sell signal.
Conclusion
I hope you have enjoyed this support and resistance tutorial. We have gone over the major types of support and resistance and how I use them as indications of market condition (trending or range bound), levels to look to buy or sell from, levels to define risk and as a framework to understand what the market has done, what it is doing and what it might do next. When you combine a solid understanding of support and resistance levels with price action and market trends, you have the triumvirate of trading: T.L.S, which you can learn much more about in my Price Action Trading Course.
I WOULD LOVE TO HEAR YOUR THOUGHTS, PLEASE LEAVE A COMMENT BELOW :)
Any questions or feedback? Contact me here.


Well explanation
Thanks alot for the time invested to expand it in details 👍
Thanks for your beautiful lessons, the point I reached is just drawing channels, markets move in big and small channels all the time, even in a minute, channels can be easily drawn and used.
I agree that the strongest support and resistance level are confirmed in weekly time frame. When the price is existing near this level,we can closely detect whether breakout or retracement in lower time frame such as 15M which I like by using suitable strategy.
Thank you so much for the contribution on this fundamental topic. It has really helped to clear a lot of things and it has given me a better understanding of support and resistance and how to use them in different scenarios.
Thank you so much and God bless you.
thanks very much!!!
Career changing article. God bless you nial
I came across this article so very late,it’s one of the best if not the best article i had the chance of reading.It gave me a broad understanding of trading at support & resistant.A very good one i urge others to read it, atleast a couple of times.Thankyou Nial
I enjoyed reading this material. Could you tell me what makes one S/R level more significant than other.
so motivating NIAL!
Indeed, thanks very much
Thanks very much !
Thanks a lot
Great knowledge for me.Thanks.
It is nice
I enjoyed reading your post, it really helpful. kudos
As a newbie to Forex Trading, after reading this, i dont want to read any other material on SR, you have said and written it all. You are indeed the bomb.
hi.thank you very much
Nial- Your site[free] or not , is the best there is. Always informative and a pleasure to visit, newbie or advanced traders. Thank you for time and effort.
This is what I`ve been struggling with. I think now I`n turning the corner in trading. Thanks Nial.
Give it time mate. Everything comes together eventually.
So thank
thanks for your insight and support you provide, things are getting clear now.
Great overview and refresher of these key levels
perfect
thumbs up
Better explanation. things are getting clearer. Thanks.
Excellent
what a great site on forex tutorial
Great writing and content!
The price action authority. Simply no other title!!!
This is by far the best support and resistance tutorial I ever had!
Nial is simply the best!!!
Chuan Loon Lye have a look at this post, they is useful
Thank you for sharing your knowledge about price action. You are truly an inspiration to all aspiring trader . I just want to ask, how do you distingusish from drawing a key support or ressitance and just support or resistance? Where do you base drawing a key resistance or support using the daily or weekly timeframe?
An excellent explanation
Support and Resistance are the backbone of trading.
Thanks Nial. Very useful tutorial.
i know first price action from you article web… now my trade better.. thanks nial
This is very useful. Thank you very much
Nial I must compliment you for yet another eye opener,I have just added the 50 EMA to my charts and what I see is unbelievable,May the Lord bless you abundantly
Very good explanation. Thank you.
This is one of the best eye opening articles needed for a successful trading career.. Pls keep it coming.
very very nice and good teaching support and resistance level, thank u
Hi Nial, thanks for this great lesson. I have a question. Most professional traders use trend lines as support or resistance as well. Why don’t you use trend lines? What’s wrong with them?
Gooday Nial,
thanks man I now know what is dynamic support & resistance.
It is very useful one to me. I got new things on Sup and Res. Thanks a lot Mr. Nimal. It made me much eager to learn more about Price action. Bless of the load Buddha!
Very informative Sir….Thank you
Master Trader thank you Nial. Excellent article concise and easily understood!
Nicely put. Thanks
Thank you for the lesson. It gave me more confidence now
Thanks Nial you are always motivation, appreciate a lot.
Thank You Nial, What a great writing
This article is truly from ” The Authority ” of Price Action Trading
Everytime I have challenges, you post the answers. Love the synchronicity. Namaste
Nial,
You;re a foundation for new and used (experienced) traders world wide. Thank you again for what you do.
Regards,
Richard
Thanks Nial for this great lesson. You have completely changed my trading view so far. It has dramatically improved my trading results.
Big fan of you from Iran
Thanks Neil.. another excellent article .. i am bookmarking this page for a quick access rgds jenny
Price action types … thank god
Fantastic insight. Brilliant explanation. Thx Nial
From a technical point of view, this is your best article Niall. Its the best article explaining support and resistance I have read.
Hi Nial, I just want toa ask you;”How about the EMA 8 (T-LINE) ?” Did you still use or not … How about EMA 150 & 365 at 60 Minute Charts ?
8 and 21 ema on daily can act as short term ‘dynamic’ support and resistance. I’m no longer using the other ema’s on lower time frames.
I love this article. Thank you 😊
Terimakasih Nail..pelajaran yg sangat berharga untuk kemajuan trading saya.
good one …eye opening..thanks Nail.
Thanks for sharing. Like to see more investing information
Niall, this has to be the best article I ever read.
Thanks Sir. My forex challenges are being addressed by your post. Great post I must say. Thanks