Trading Breakouts Often Leads to Losing Trades
 Breakouts are tempting, in fact, most people trade in-line with the direction price is currently moving without much thought; they are reactive with a ‘herd’ mentality. Now, one might say trend following or trading with the herd / sheep is the correct strategy and in theory it often is, but when it comes to the actual trade execution there is always a higher probability area and lower probability area to enter, and trading on the break-down to new lows or on the break-up to new recent highs is often a major trap, especially for novice traders.
Whilst I’m a huge advocate and fan of trading with momentum and the path of ‘least resistance’, even when I am trying to get on board an existing trend, I rarely trade breakouts, instead, I wait for price to pullback to value (support / resistance area) where I will get more factors of confluence lining up.
Examples of why trading breakouts can be dangerous.
Today, I wanted to show you some recent real world “BOMB” breakout trades that totally sucked the market in ultimately to revert back in the opposite direction.
Millions of dollars were made and lost in these moves and I am certain some of you got caught in these. Whilst it’s impossible to know when and where these ‘traps’ will occur, we can look at the carnage that resulted and learn some important lessons…
In recent months, you may have noticed how many fake-outs and ‘suck-out’ traps / false breakouts have occurred.
Here are some examples of recent breakouts that sucked traders in and spit them out like used chewing gum…
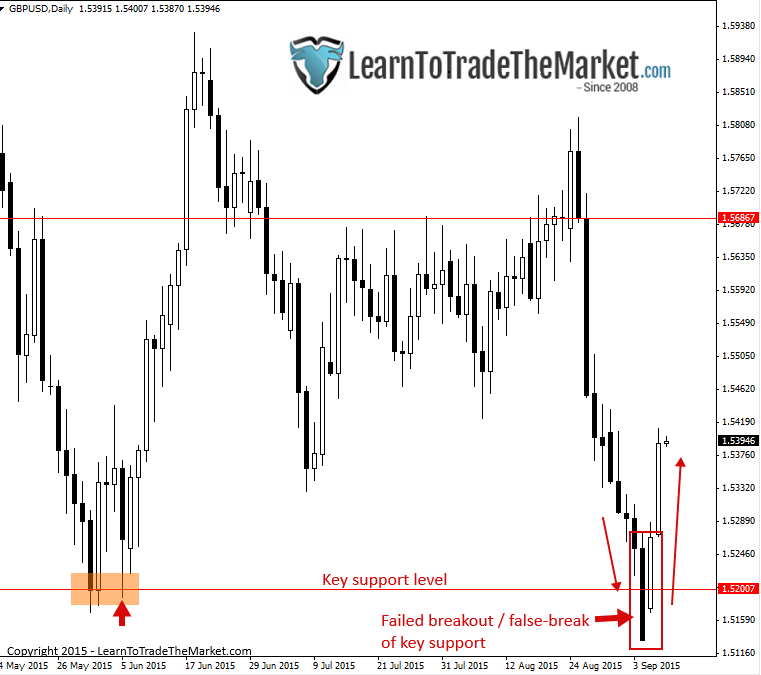
The first chart we are looking at is a ‘classic’ example of a failed breakout and false-break of a key support level in the GBPUSD. Notice how price broke just below the key level and then quickly reversed, moving significantly higher and sucking out everyone who sold at the lows / as the level broke…
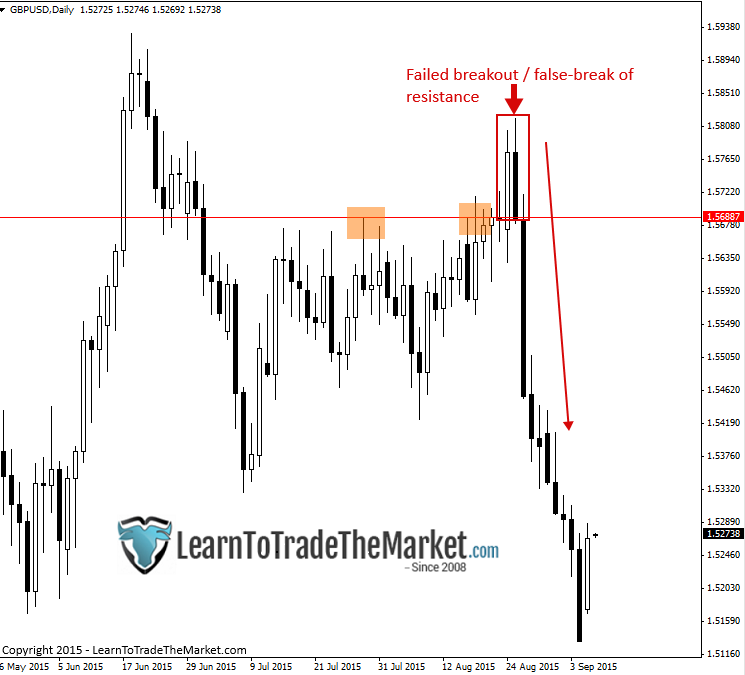
The chart below shows us a recent breakout that failed in the GBPUSD. Notice how price was looking like it wanted to break up above that resistance at 1.5688 for some time. These types of breakouts seem to be the most dangerous; the ones that ‘seem’ very obvious…because they’ve attracted all the amateur players and after they give in to the breakout the pros step in and flush them all out by sending price the other direction…
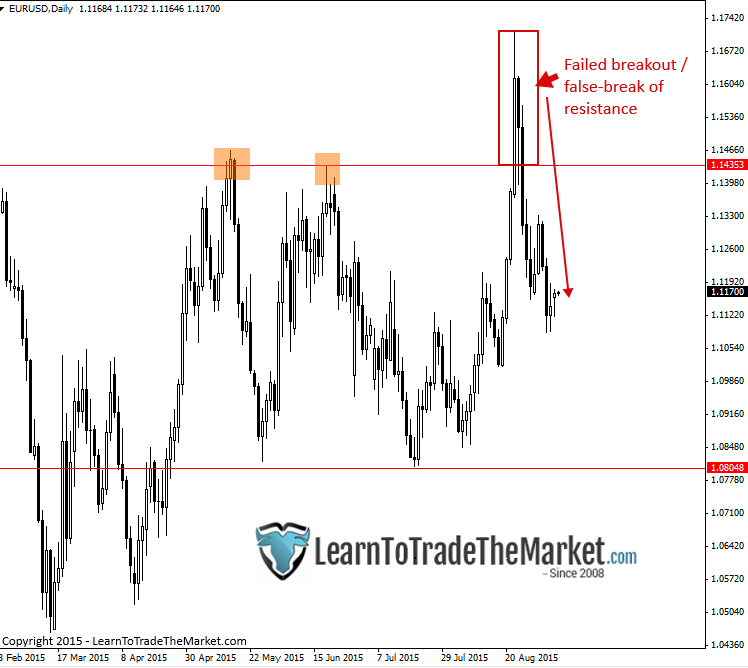
In the next example, we see a clear false-breakout above a key resistance level in the EURUSD recently. Note that this market was (and still is as of this writing) in a trading range. False breakouts are common in large trading ranges like this one…
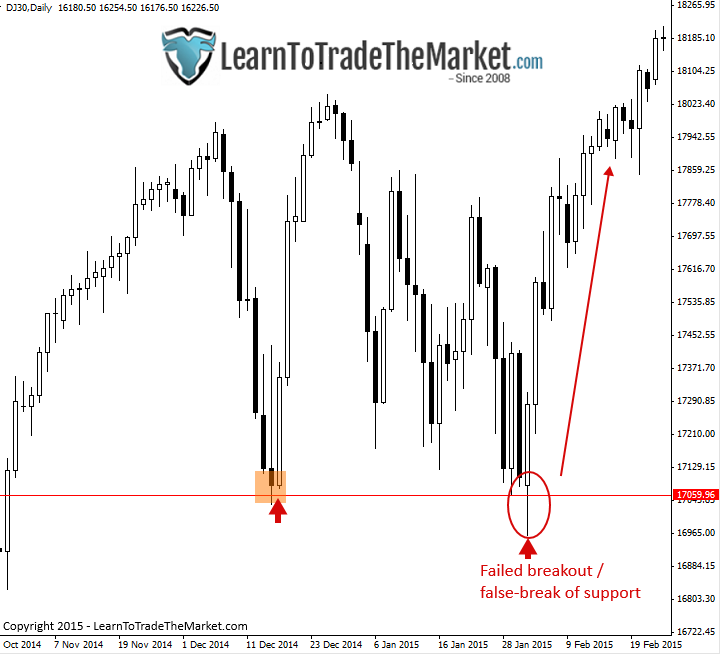
In the next chart, we see a clear failed breakout in the Dow30 as price made a classic false-break of key support near 17060 early this year before surging back higher, in-line with the longer-term uptrend. Key levels like this are often prime targets for failed breakouts to occur and shake out all the people who thought the move would keep going beyond the level…
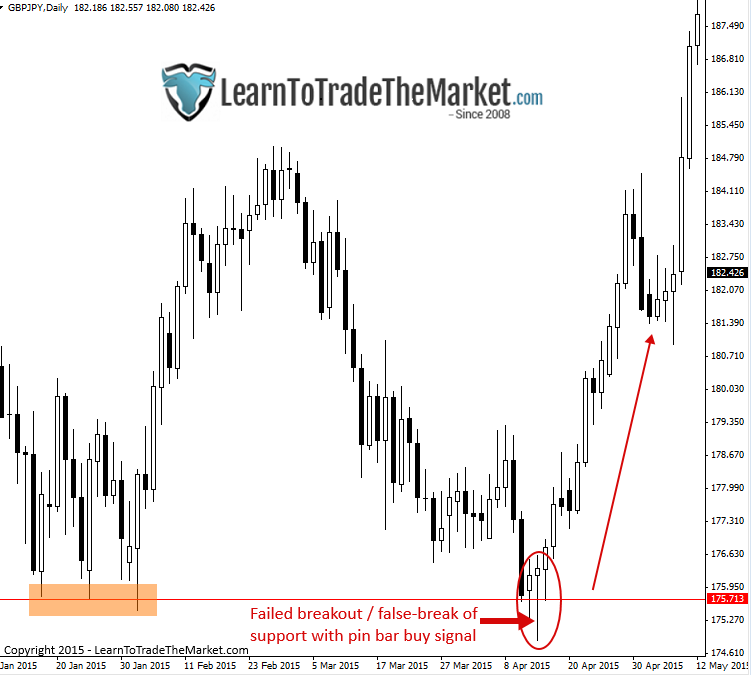
Here’s another clear failed breakout / false-break of key support. As price comes back down to test the level, the ‘obvious’ play is to trade the breakout…everyone thinks the market will continue lower. But, it’s at that point that there’s no one else left to sell and the pros come in and stop everyone out and push the market higher…
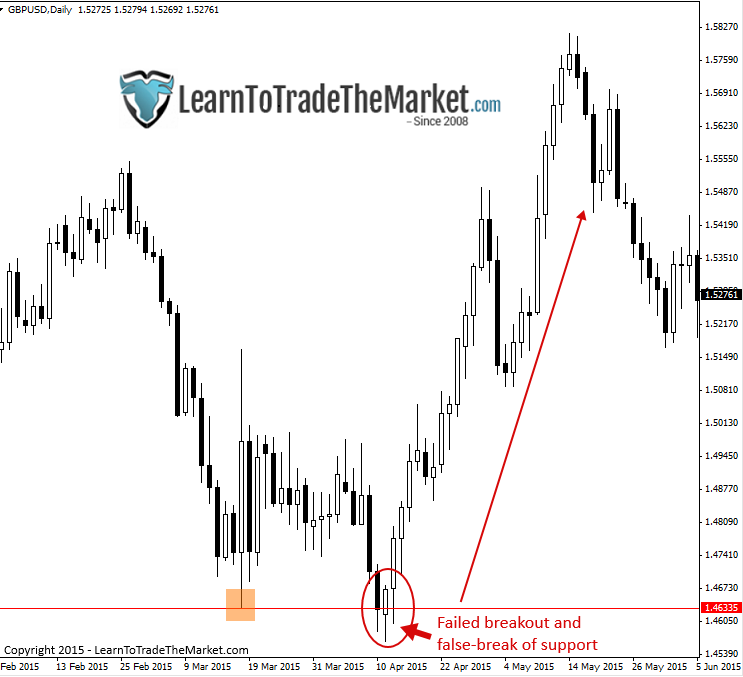
Often times, failed breakouts can be good trading opportunities to fade or trade the opposite direction of the breakout. In the chart below, we see a clear example of a failed breakdown of support in the GBPUSD that was accompanied by a nice pin bar buy signal which led to a substantial move the other direction…
Alternatives to breakout trading…
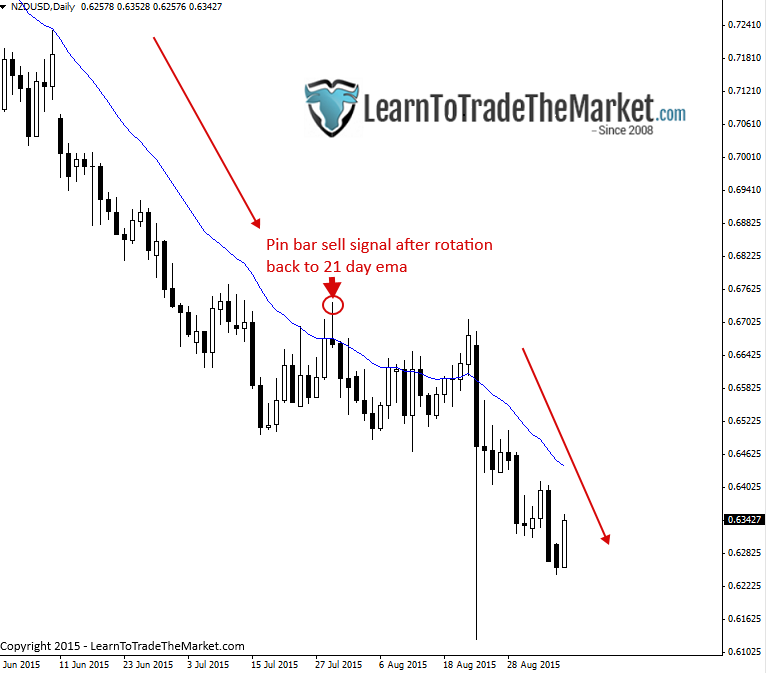
Now, let’s look at what I would call a more text book entry, trading with the bias of the market after a retracement…
In the chart below, notice how price rotated up to the 21 day EMA resistance level or ‘value’ and then formed a pin bar sell signal in-line with the downtrend. This was a confluent pin bar signal that had a high chance of working out since it was with the daily chart trend and formed after a pullback. Trading like this largely eliminates the potential to get caught in false-breakouts…
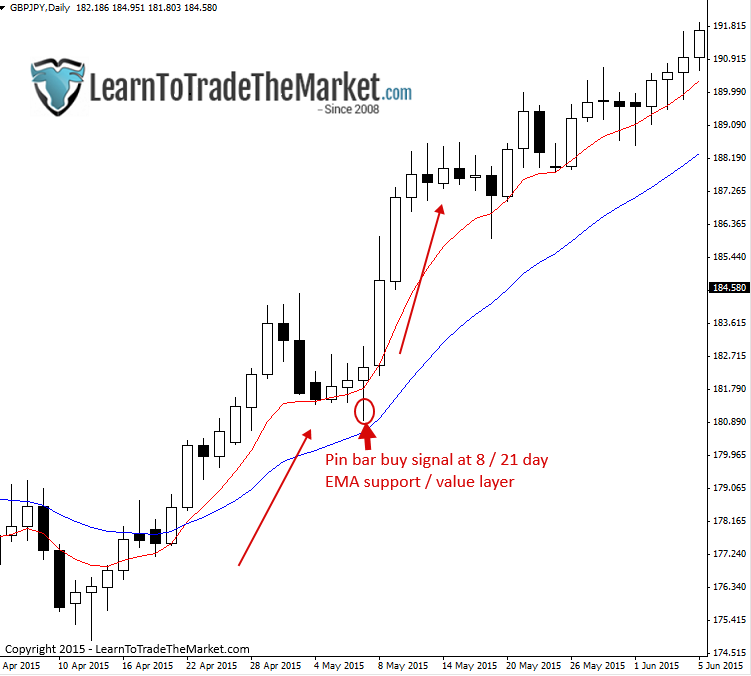
Here’s another example of waiting for a pullback to value to get in with the trend from an optimal entry point. Note the uptrend that already existed, then price pulled back to the 8 / 21 day EMA support layer (value) and formed a pin bar, at that point we had everything lining up for a high-probability entry into the trend…
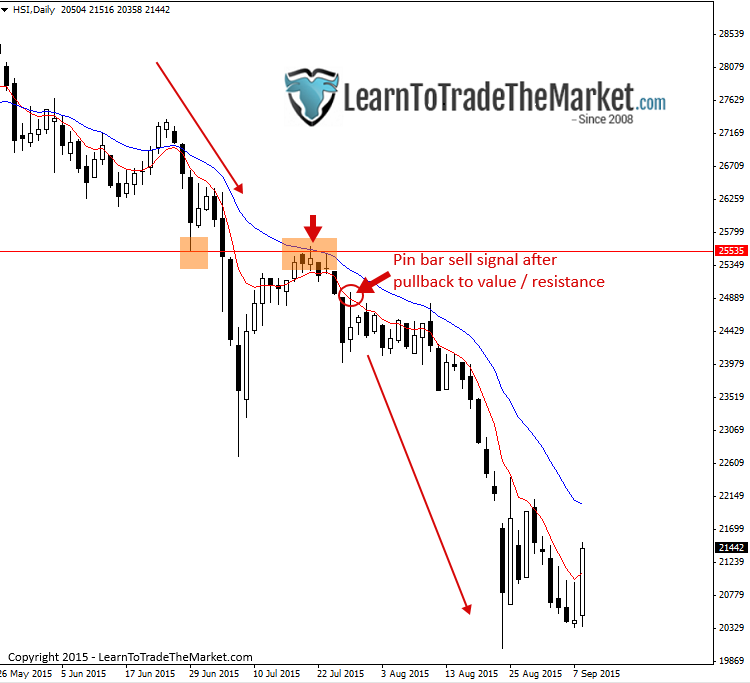
Let’s look at another example of waiting for a pullback and looking for a signal with the trend that has confluence. Notice in the Hong Kong Index chart below, price was in a clear downtrend before it rotated / pulled back up to a resistance level, shortly thereafter it formed a pin bar sell signal in-line with the trend from the 8 / 21 day EMA layer.
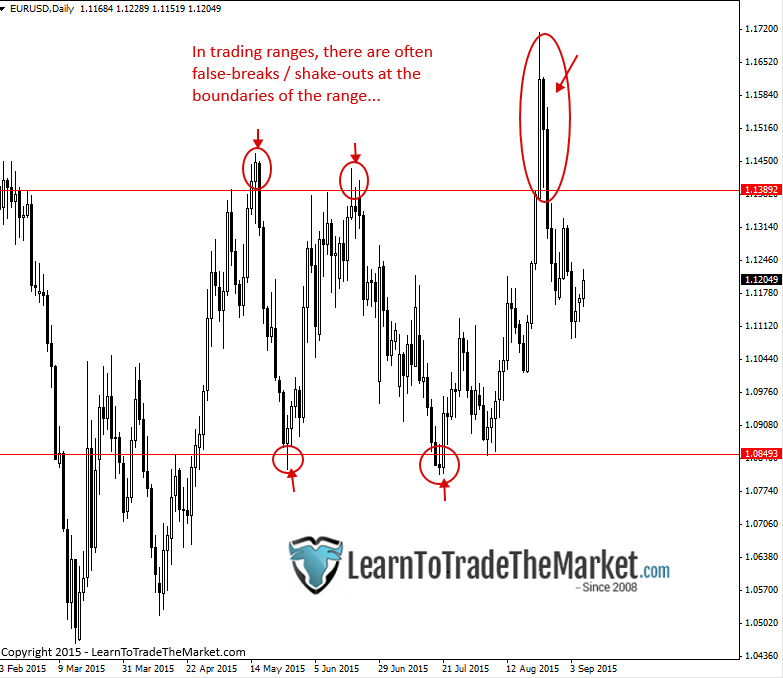
Let’s also have a look at how a trader can play both sides of the market in more sideways to neutral bias conditions, these are often the most dangerous periods where major shake-outs on the extremes of the range occur…
Notice in the EURUSD chart below that it was in a defined trading range, and still is as of this writing. In these situations, shake-outs / false-breaks at the extremities of the range, are very common. Knowing this, professional traders will fade these levels, meaning when price gets to them, trade back toward the opposite level…until price clearly and finally breaks out of the range. This is a good way to take advantage of range-bound / non-trending market conditions. It can be done with a price action signal or without, on a ‘blind entry’.
Key takeaways…
- Thinking contrary to the ‘herd’ is a skill you must develop through training and screen time. Contrarian market thinkers usually win out in the end.
- You can still trade with the trend but think contrarian, e.g., the examples above of looking for pullbacks / retraces to value and confluent levels in trending markets. Breakouts are NOT the only way to trade with a trend, and in fact are not the ideal way to trade trends.
- Waiting for price to rotate back to obvious levels and then looking for price action signals at those levels
- When markets are in trading ranges you can look to trade or ‘fade’ the trading range boundaries as price approaches them (trade back toward opposite end of range).
- Failed breakouts / false-breaks are good trading opportunities, look for signals at the failed breakout or shortly thereafter (see GBPUSD false-break with pin bar example above).
- Don’t sell into a key support level or buy into a key resistance level. If you really want to trade in that direction, wait for price to close outside of the key level for at least a few days and THEN look for a an entry on a retrace / pullback to value.
In summary, breakouts can lead to losing trades, especially the most ‘obvious’ ones which tend to ‘fool’ all the amateur traders.
This doesn’t mean you should ‘never’ trade breakouts, it just means you should approach them more thoughtfully and look for other, more contrarian entries into the market, as we discussed in the examples above.
It’s human nature to want to buy or sell a market as its moving in the direction you want to trade, but this alone is not a high-probability trading strategy. Markets ebb and flow and you need a trading method that allows you take advantage of this, rather than getting taken advantage by it. To learn how my price action strategies can help you develop this contrarian view and trading approach, check out my course here.


This is a good tutorial for beginners nobody could have been failed to make money if he/she followed a great teacher in the world
very nice
Very informative article, thanks!
Nial … Sir thank you so much for yourguidance. Very good article for traders like me who are amateur traders.
So many trades lost thinking I am going to catch the rally after S/R line!!!! Thanks Nial.
one common trend on these false break outs was the formation of either twizeer bottoms or tops. like all the amazing information you put out “trading like a sniper” which sniper have all the patients in the world to execute it safe to say to either go long or short on a retest would have made a world of difference. you’re awesome! :)
Tku, sir, I agree with you, your article make me more confidence
Awesome,,made many similar mistakes in past . Now I know why. Thanks for the article.
Thank you Nial, very useful.
Thanks Nial, great article much help!
This very interesting Nail as this the most mistake I make since I’m still new in this business thanks so much for saving me
Very educating as well as entertaining. Thanks and keep up the good work, Nial.
Thank you mentor. This article is most timely. God bless you Nial. More grace!
BRILLIANT,,, SIMPLE AND USEFUL…THANKS NIAL
many good points in this one. almost to good ;) good thing i am already a member right!
Keep the great work “Munehisa Honma” of our time.
I’m proud to call you the Master.
Cheers
Brilliant article Nial. Not all the breakouts are going to be successful. As you say follow the price action and make decisions based on that.
Thank you.
You nailed it Nial. Your teachings are excellent, thanks
Nial
Excellent article and suggest those who want to trade like you do need to find say 50 examples of each Takeaway point and drill them into their mind. Suspect this is what you mean by chart time.
Also
Hi Nial, thank you so much for teaching right to every single detail , we really learnt a lot
From you especially how to study market structure in context as this article & every single day commentary.
James
That was an excellent and timely article Nial. I had been pondering the best ways to trade breakouts when I received your email.
I really appreciate you man. I’ve learned a lot from you.
Hi Nial,
I’ve been studying your free trading strategies and I’m thinking about signing up for some of your courses. I trade the S&P emini futures. Do these strategies also work for the emini’s?
Price action is universally applicable to all markets, however I do suggest higher time frames (above 1 hour, ie: 1 hour, 4 hour, daily charts).
thanks nice work
No words for Your professionalizm! Just on time, discussing recently occured breakouts. Thanks Nial, invaluable article! Question. Does these kind of breakouts occur in other timeframes?
Daily charts are my main focus, and the article uses mainly daily charts as examples. As traders, we get a clearer picture of market structure on higher time frames.
Thank you Nial for another interesting article and great chart examples.
This information is priceless. I’m always amazed with your ability to see “forest behind trees”.
Thank you, Nial!
Hi, Neal You showed well and explained the false breaks of static levels, well, you think like me
Hmm….I will read later as I like breakouts…
Nial, thanks !!!
Thank you Nial for you powerful teachings, this is great stuff you can not find on any other site. i really appreciate your work on Price Action. God bless you.
Very cool article! Thanks, coach… not to mention that EUR/USD is dancing around the key level of 1.14 right now. We may have the opportunity to exercise the above teaching on EUR in the coming days…
I think that a break out strategy can be very effective if you use it on stocks, especially fast growing companies. The nature of the forex market is very different indeed in term of price behavior. I would like to know you thought about that.
Absoluetly brilliant, practical trading article Nial. Let the obvious price action tell you when to enter a trade. Simple…!! Cheers mate!