The Market is Speaking, But Are You Listening?
 Are you listening to what the market is telling you or are you only listening to yourself? The market ‘speaks’ its own language, that language is price action, and not only do you need to be fluent in the language of price action, you also must be able to apply what the price action is telling you in an objective and neutral manner.
Watching the price charts of any given market is something you must do every day if you want to really stay connected with that market and learn how to trade it. I like to think of following price charts like reading a book – to understand the story, you must read each page because what happened before will help you to make sense of what is happening now and where the market might go next.
How to ‘listen’ to what the market is telling you and apply it
Each day, at the close of the market you should check your favorite charts, it’s like reading a page of the market’s story for that day. You can see what happened, who won the battle between the bulls and bears and whether any price action signals formed as a result. It’s important to make this a daily routine so that you don’t forget what has happened and what the market is doing, otherwise, it will take you some time to get back into sync with the market’s rhythm.
When you look at a zoomed out daily price chart or a weekly chart of any market, it’s not hard to quickly see the primary direction that market is headed. This is going to be the ‘right’ direction to trade in, 90% of the time. Yet, time and time again, traders over-complicate this. Rather than zooming out, and getting a feel for the overall dominant direction of a market, many traders want to zoom in, further and further, down to minute charts, where they are basically seeing nothing but noise.
- The most obvious direction is usually the right direction
If you remember nothing else from today’s lesson, remember this point: the most obvious direction is usually the right direction. What that means is basically what I said in the previous paragraph – the primary direction, from left to right that a zoomed out daily chart is moving, is typically the direction you want to look to trade. So, determining this direction is the first step of ‘listening’ to what the market is telling you. Don’t over-complicate it! Just zoom the chart out and see which way it’s generally moving from left to right.
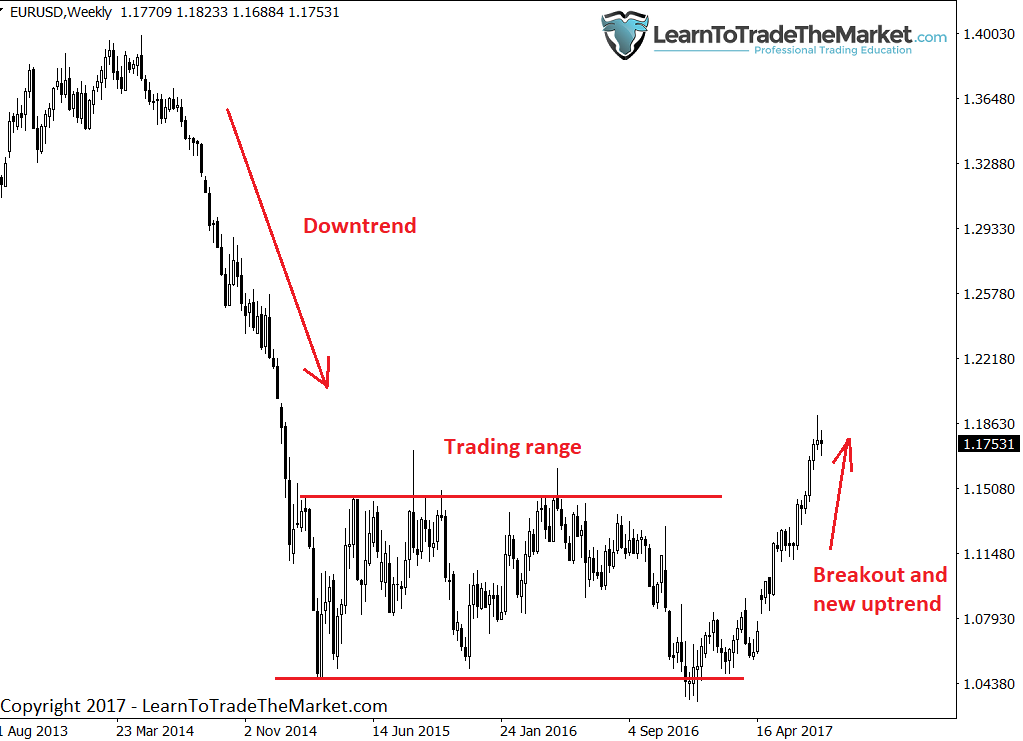
Look at the weekly EURUSD chart below, we are looking back at about 4 years of price data here. This is how you quickly determine what the ‘story’ of a market is. On this chart, what I see is a large downtrend that unfolded, followed by a large period of consolidation within a large trading range, and most recently we can see price broke up through that trading range and is now trending higher. So, the current most obvious direction of this chart is up. You see how simple this is?

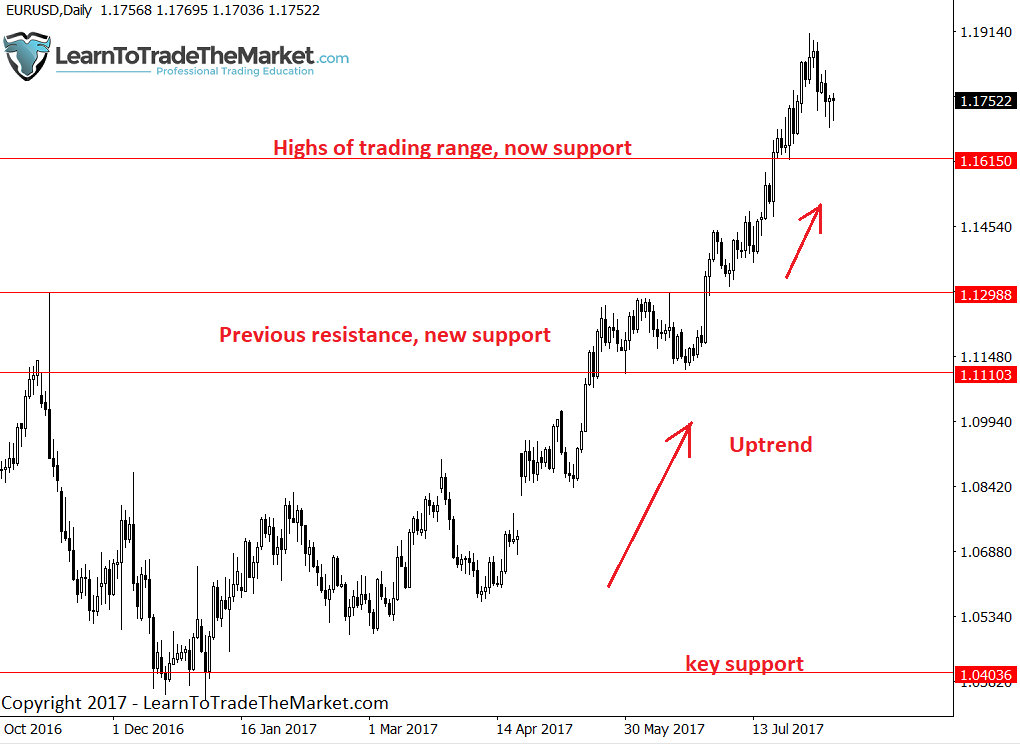
Next, let’s move down one-time frame, to the daily chart time frame (my favorite). Here, we can see the market found a lot of support at 1.0400 and has recently taken out the highs at 1.1100 – 1.1300 and more importantly, the highs of the previous trading range up near 1.1615.
This is how you read the market from left to right. It’s not hard, it’s just like reading a book, you need to understand where the market has been and where the key levels are to understand what is happening now and what it may do next…

- Path of least resistance
We always want to trade in-line with the path of least resistance. In the EURUSD examples above, the current path of least resistance is up. So, that means we will look for price action buy signals on pull backs to support or value areas. The market will TELL YOU what the path of least resistance is, all you must do is zoom out and ‘listen’.
- It only pays to be contrarian sometimes, not always. Don’t let your ego take over.
Whilst I am a fan of contrarian thinking and contrarian trading, everything has its exceptions.
It’s important to not become so contrarian that you are no longer listening to what the market is telling you. For example, if you get long on a breakout that ends up becoming a failed breakout, do not simply stay in the trade because you feel so strongly about it. If you do, you are no longer listening to the market, you’re listening to only yourself. A false break is a like a big warning signal and you need to listen and take heed of that signal, not ignore it.
In this way, price action can help you exit bad trades just as it can help you enter a trade. A massive bearish or bullish tailed bar against your position or false breakout as just mentioned, can often be a signal that the market is going to reverse, so if you arrogantly stay in a trade even considering such a reversal signal, you are not listening to or trading in-tune with the market, which is a very good way to lose a lot of money, fast.
Remember, trade what you see, not just what you think, and don’t get emotionally attached to any one trade. Trade in harmony with the market, not against it.
- The importance of price action signals
As we are reading a market’s price action and ‘listening’ to what it’s trying to tell us, one big obvious piece of data that we need to pay special attention to, is a price action signal. Price action signals often convey very important information about a market and so we need to not only be aware of them and on the lookout for them, but understand what they might mean.
Perhaps the most important thing about price action signals, especially those on the daily charts, is to not be the proverbial deer in the headlights when you see one. In other words, don’t freeze up and (or) panic when you see an obvious price action signal, don’t over-think. An obvious daily chart price action signal can act as either an entry signal or an exit signal and is something you should always take note of either way. They are important clues in the ‘story’ the chart is trying to tell you and they can often help you figure out what the market is likely to do in the near-term.
- Confluence – when you see price action signals at event areas or key levels, the market is telling you something.
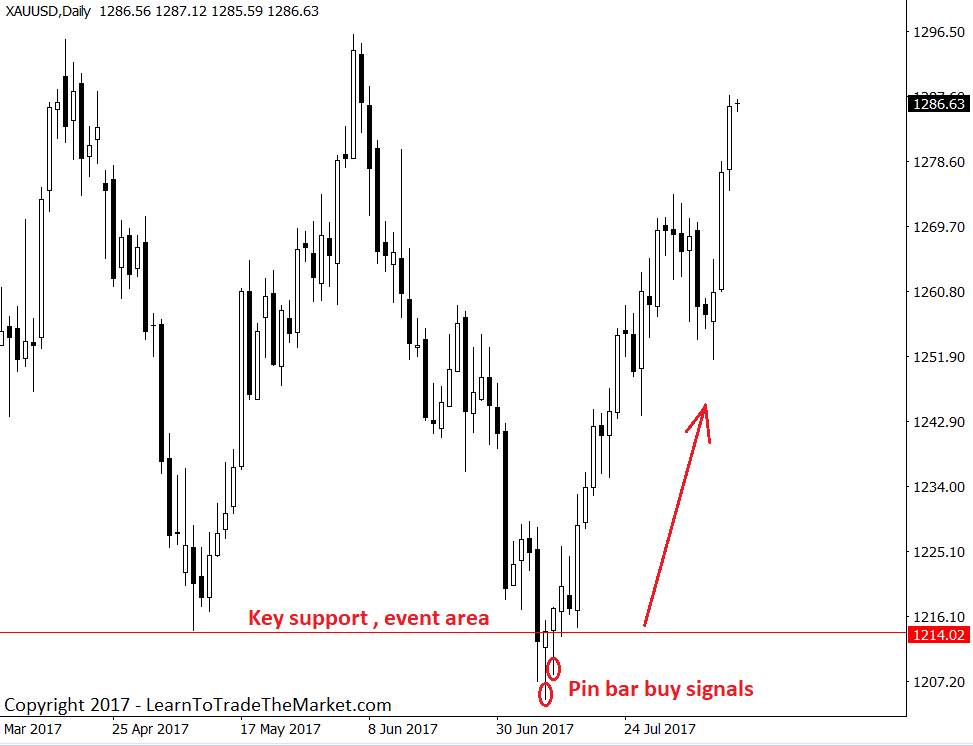
Let’s look at another chart. You will notice in the Gold chart below, price formed two bullish tailed pin bar signals at a key support level and event area down around $1215.00 – $1200.00; an area we had discussed extensively in our members daily trade setups commentary as a strong buy area in early July. When you get a clear price action signal at a clearly obvious level like this, you are looking at a confluent price action signal and this is a core pillar of my trading approach…

Conclusion
As a beginning trader or as any trader looking to learn to trade with price action, it’s critical you understand how to read and interpret the ‘story’ a chart is trying to tell you. You do this by first learning to read the chart from left to right and then learning to interpret individual price bars. This gets easier the more you do it, but it is important you check in with your favorite charts almost every day so that you stay connected and in-tune with the market.
Eventually, you will begin to develop a trader’s intuition and when you see certain market conditions or patterns, you will simply ‘know’ what the market is trying to tell you, like a flashing light saying, “I’ve seen this before”. The journey of trading never truly ends, but if you are passionate about it, you will look forward to learning how to read the price action and learning to ‘hear’ what the market is telling you.
I WOULD LOVE TO HEAR YOUR COMMENTS BELOW :)
QUESTIONS ? – CONTACT ME HERE


Read the tutor’s articles daily and gain daily.
It’s awesome to trade with you
I want to learn more about reading the chart. thanks God bless ????
Thanks for the insight..
I want to learn more about reading the chart. thanks God bless ????
Reading this article greatly stabilize my trading method
i really appreciate your effort
Thanks Nial
nial this is best to zoom out and trade inthe direction of the market with a confluent pa signal i like it on a pull back . this wil be on my tradin plan
Yes I want to learn how to trader pls help me
I’m still not clear on what you mean by the “primary direction of the market”. On the daily (or any ) chart, the market may be in the midst of a counter move by several bars, but the chart overall is going the opposite way. Which is primary? If you are looking at a daily chart, you may suffer a huge drawdown before the market goes back in the direction of the larger move.
This is simply fantastic. How can a trader remain deaf after reading a masterpiece like this from the don himself? I am blessed boss.
yur articles alway make a lt sense. I learnt a lt reading this. if you wuld nt mind, can I know the airs you prefer or yu cand advise your students to chise as favurite
Thanks for the precise information. It was very useful.
Spot on, as usual.
awesome as ever, Nice article
many thanks to Nial, our mentor, for a nice article!
I learned alot in this write-up,thanks a millionaire times
Thanks for your explanations i now begin to understand
Everything I know about trading today, I owe it to you Mr Fuller. It wasnt easy when I started but now Im developing this traders intuition youve mentioned in this article. I thank you my Mentor, Salute.
Hi Niel,
thanks for those insightful thoughts. I am enriched by them. More wisdom to you.
Very very true and helpful article. Thank you teacher. May Allah bless you…
Thanks Nial, I wanted to give up but with you , I am regaining my confidence. You are my mentor so long as Forex Trading is concern.
Thank you for your sharing. It’s useful for me.
One truly has to be patient and check in on the market. Gold right now is on its way down after a bearish engulfing pattern!
Thank you nial for teaching us patience and preserverance.
May your days be long on this earth.
hi, learning everyday, like building a puzzle every article im reading is making the picture become clearer. thank you Nial
Clear and concise. Confluence is everything. One day at a time. This important information is sinking into my mind.
Thanks Nial
This is simply amazing stuff. I like the way in which Nial puts it – fluency in the market language. This stuff invites one to get down to the study of chart and candle-stick patterns and understand their interpretation so as to develop this fluency in market language communicated by the price charts.
Many thanks boss you actually hit the mail in its head. more grease to your elbow
Great article and just in time for me. Always appreciated, thanks so much my mentor.
Paul G
Thanks for the insights that make the market so simple to conquer. Since I became avid follower of your insight and understanding of the market my experience and love for the market has changed. Thanks for this consistent gift to the world at large.
Thanks Nial though its difficult to read charts but this article has helped me a lot.
Its a great article for ,thanks Nial
Thanks for such a powerful article Fuller. Reading market this way is simple and it works. Thanks for such a straightforward lesson.
Hi, Nial if I found a down Pinbar bellow EMA 21 By Close in the weekly charts, can I directly open the trade base the Weekly Chart self ?
This is great and more ingsightful. Tanx Nial.
Support / Resistance ( key levels)
+
Price Action Pattern
is the best trading approach, I discover after about 12 years of trading.
I learned from Al brooks, Neil and Galen woods. Thanks guru’s.
Thanks Neil for this post, very very useful…
This is not only an article but also a definite price movement description. Thank you very much
Thanks nial you are shared the best way to trade the forex markets…
Thanks for the Neil, good information you giving us there and helpfull.
thank you sir. your teachings work!!!!!!!!!!!!!!!
Great reading and so helpful materials indeed, Nial, thank you very much.
trying to be a trend follower is what u always teach us! it WORKS. trading daily charts is the key and also trade near or from confluent area. NIAL FULLER is the KING of trading. your method is so simply but it is indeed extremely GOOD. YOU also teach us MONEY management which is another important part in trading . GOD bless NIAL FULLER
Nial , Highly appreciated , God bless …..
trying to be a trend follower is what u always teach us! it WORKS. trading daily charts is the key and also trade near or from confluent area. NIAL FULLER is the KING of trading. your method is so simply but it is indeed extremely GOOD. YOU also teach us MONEY management which is another important part in trading . GOD bless NIAL FULLER.
What about over bought/oversold situations ? How to recognise a reversal from a pullback. The market does not go up/down for ever.
It’s always a mind opening to read your articles, it actually clarifies a lot of things to me as a beginner trader. Looking forward to joining your course to learn more from a mentor I admire from afar.Thanks Nial
Good reading helps to inform you about price action more positive thinking thanks.
Right on the mark! All the best learning in the world is of little use if we do not (or cannot) pull the trigger.
Since I started ‘Listening to what the market is saying’, I have
made more,better and consistent progress than ever.
ALL THANKS TO Mr NIAL FULLER.
Nial, Your articles are a God Sent to traders
Thanks for this article.It is educative enough.
Thanks for giving us the very educative value in our trading arena.
Thanks for reminding Nial. Excellent reinforcement of a potent trading principle.
Great advice as usual. Thanks Nial.
Thank you sir Nial. Your website helps me a lot to learn one by one the price action. I hope this learning will continue as i started the path of being a trader. God Bless You
Thanks again sir…great article
You’re worth your weight in gold Nial; for a novice trader, this article is like a beacon to a ship out on the open ocean.
great article i am applying these stratagies to my trading trying to be more patient and my account is now moving into nice profit its a nice feeling
Thank you Nial for the heads up….Thank you.
” the most obvious direction is usually the right direction ” and ” TLS principal ” thanks for this words Ill always remember them
Niall, can’t agree more. Beating your emotions and listening to the market is key. It’s a constant battle. Listen to the charts and block out the noise. Be consistent in your process and approach.
Thanks Nial for ur another great article.
Always waiting for that, now done read, Thanks Boss. Now again waiting for next.