3 Fool Proof Tactics to Distinguish a Trending Market From a Sideways Market
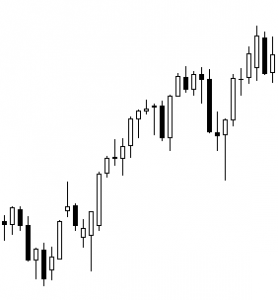 One of the most important things we have to do as price action traders, is determine whether a market is trending or not. The answer to this will determine which approach you take to a particular market, so it’s critical that you understand how to properly differentiate a trending market from one that is sideways.
If you’ve been struggling with this recently, or you are new to trading, this lesson is for you. After reading it you should feel that you have a much clearer understanding of exactly how to distinguish a trending chart from a non-trending chart.
Look for trending price action patterns
This first tactic has been around for literally hundreds of years and for a very good reason; it works.
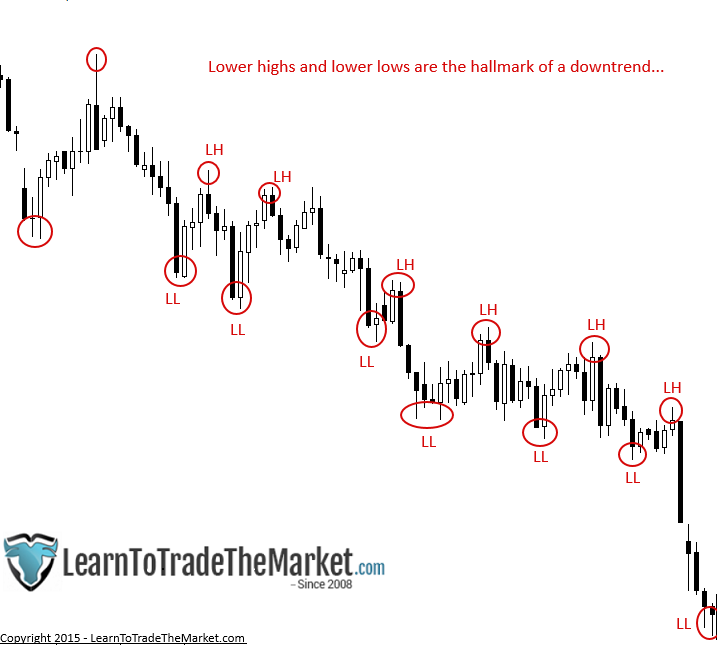
My favourite way to determine if a market is trending or not, is to simply look at the price action of that market. Very simply, I look for a repeating pattern of Higher Highs (HH) and Higher Lows (HL) in an up-trending market and Lower Highs (LH) and Lower Lows (LL) in a down-trending market.
Here is an example of a market that was obviously trending lower as evidenced by the repeating pattern of Lower Highs and Lower Lows…
Here is an example of a market that was obviously trending higher as evidenced by the repeating pattern of Higher Highs and Higher Lows…
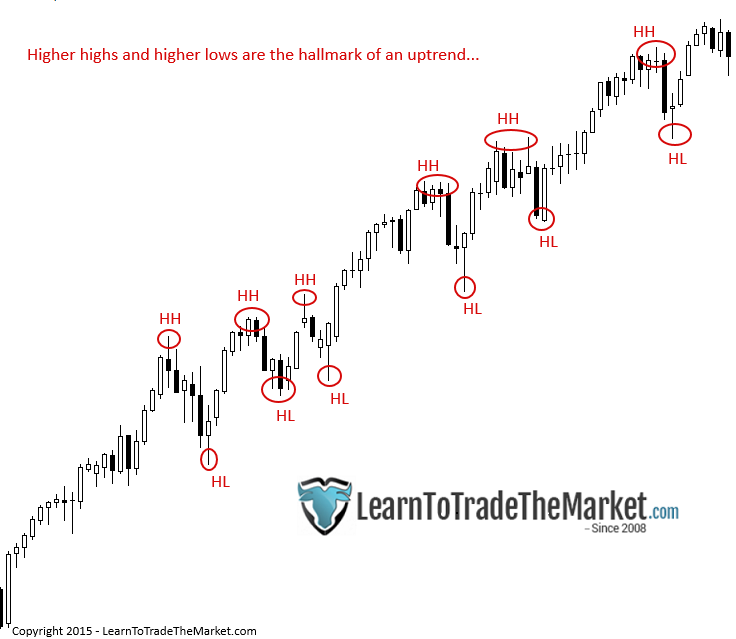
Tip – I often get emails asking me how I know when a new trend has begun or an old one has ended. Well, you use this same tactic of looking for price action patterns of HH HL or LH LL. For example, once you see a pattern of HH and HL has been interrupted or broken, by price making a Lower High, it’s an early-warning that the uptrend may be coming to an end.
To truly consider that the up-trend has ended and a new down-trend has begun however, we need to see at least one pattern of LH and LL following the uptrend. That means, once price makes the first Lower High (so it fails to make a Higher High), we would then need to see it make a Lower Low following that Lower High, at this point, we can start looking to be sellers.
Look for parallel levels
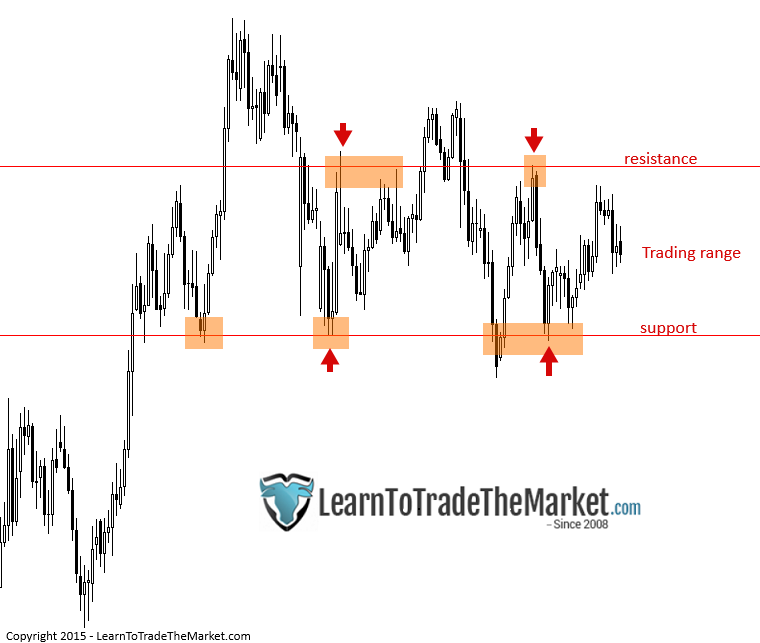
We can also use key levels of support and resistance to determine if a market is trending or not. The basic approach is to simply look for price that is clearly oscillating between parallel levels. If it is bouncing between two parallel levels, then you have a range-bound or sideways market, not a trending market.
There are two basic types of sideways markets; a ‘choppy’ one and a range-bound one, for more on this, check out my recent lesson on how to trade a sideways market.
In the example below, we can see that price was generally moving sideways between parallel levels of support and resistance. Notice that price won’t always hit these levels ‘exactly’, but if the general movement is sideways between two obvious levels, you have a non-trending, range-bound market.
Moving averages
The next tactic that we can use to distinguish a trending market from a non-trending market is the use of moving averages. Moving averages provide an easier visual clue for beginners, but they need to be used in combination with the price action tactic discussed in point one above, for reasons I will discuss soon.
I typically use the 8 and 21 day exponential moving averages (emas) on the daily chart time frame as a quick-guide for trend as well as dynamic support or resistance (value) areas.
There are basically two things to look for when using moving averages to distinguish a trending from non-trending market. One, is the direction of the cross; are the moving averages crossed up or down? I only use the ‘crossover’ to determine direction, I don’t use it in the traditional “moving average crossover entry system” that some people teach.
The second thing to look for is if the moving averages are diverging (moving away) from each other, as this is indicative of a very strong trending market. However, you need to combine the moving averages with the price action tactic from point one, because moving averages alone will sometimes fool you if a market is range bound. They are really only used as a quick reference for trend direction and to see value areas to look to buy and sell from.
The ema’s themselves mark a dynamic (moving) support and resistance zone or layer; the ema layer is the area between the two ema’s, such as the ‘8 and 21 day ema layer’, and we can watch for price action signals from this layer as price retraces back to it, to trade in-line with the trend.
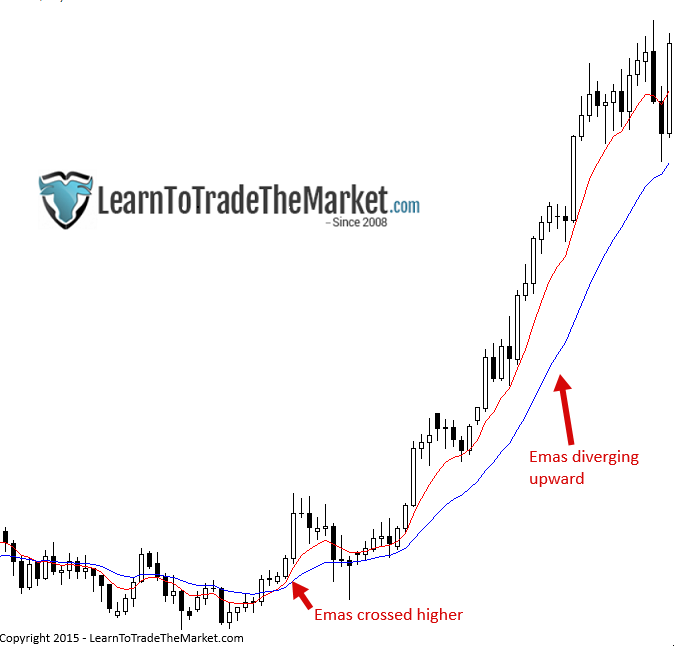
The main caveat to using moving averages for trend identification, is that in a range-bound market they can trick you. This is why you need to also use the price action method I discussed in the first point above, to act as a ‘filter’ of sorts for the moving averages.
For example, in a range bound market as described in point 2 above, if you put moving averages on your chart, they will cross up and down as price oscillates between the parallel levels. So, if you follow the moving averages in a range-bound market, you will continuously get whipsawed as price will generally change direction right as the moving averages cross. For this reason, I prefer tactic 1 above, but the moving averages can be a nice complement to that tactic and as I mentioned, they can also provide us with good ‘value areas’ in a trending market to look to buy and sell from.
Conclusion
The trend is indeed your friend, and you want to be totally clear on whether a market is trending or not before you start trying to trade it. Hopefully, this lesson has clarified how to distinguish a trending from a sideways market, so that you can improve your chances of catching big moves in the market. To learn even more about trading trending and sideways markets, check out my price action trading course.


Thanks Nial… Great Lesson. Continued Studies. Love All Your Articles. Love Reading Them!!!
Thanks Nial for this great informatiive article. especially on the moving averages.
It is highly appreciated.
Very inspiring
nice article
This article has changed my trading perspectives towards successful trading. Thanks so much Nial. May God reward you for your wonderful works so far.
Nial thanks for the gold I would Like to know how many hh hl or ll lh do I have to count to confirm entry in the market, thanks
In trading and identifying a trend there is much more than just a price action, although very important, it has to be used with moving averages that are not exponential. You should use simple moving averages that big market movers such as hedge funds and investment banks use, and those are 34, 100, and 200 SMA. Only in this way you are able to know the prevailing trend and then you can use price action to trade it.
Alex, yes there are different ways to determine trends, your ideas appreciated.
vote of thanks honorable Fuller. this article is legit
when are you next in the UK,so we can meet up and trade!
This is super. Where have you been all these years of my ups and downs? Thank you Nial!
Dear Nial,
Thank you very much for the article and this is a right subject in the right time. Sharing the knowledge is the highest form of generosity.
Thanks again
Thank you
Anne
Good article sir
Dear Mr.Nail,
Moving Averages are good but, it’s uncomfortable to use it for trading sometimes. its very comfortable to trade with price action using candlesticks and few horizontal lines. i am very happy with it and never try to change it.
Once again a good article. thank you very much
Valuable article
Very Informative.. Thanks Nial..!
GOOD ARTICLE !